Conduct reversal tests on directional data in MagIC format using PmagPy#
Introduction#
This notebook is a template for importing data and conducting reversal tests using PmagPy. You can use it on any MagIC contribution with dual polarity site data. The example that is given is on paleomagnetic directional data from the following study that is in the MagIC database (https://earthref.org/MagIC/19903):
Ao, An, Dekkers, Li, Xiao, Zhao, Xand Qiang (2013). Pleistocene magnetochronology of the fauna and Paleolithic sites in the Nihewan Basin: Significance for environmental and hominin evolution in North China. Quaternary Geochronology 18:78-92. doi:10.1016/J.QUAGEO.2013.06.004.
Change the MagIC contribution#
You can change what study this notebook is applied to by changing the magic_id in the Download data and unpack data code cell below.
Apply to your own sites.txt data#
You can also substitute in your own MagIC format sites.txt file. To do this, skip the Download data and unpack data section and go to the Import the sites table section after running the Import packages code.
Import packages#
import pmagpy.ipmag as ipmag
import pandas as pd

%matplotlib inline
%config InlineBackend.figure_format='retina'
Download and unpack data#
Download MagIC contribution#
We can first download the data from MagIC by providing the magic_id.
If the directory name that is given is not provided, it will be created.
In the example, the data are put into a folder within this directory that is named reversal_test_data.
magic_id='19903'
directory = './reversal_test_data'
result, magic_file_path = ipmag.download_magic_from_id(magic_id, directory=directory)
Unpack the MagIC file#
MagIC contributions are made up of distinct tables that can be unpacked. In this case, we are going to do a reversal test on the site level data so we are particularly interested in unpacking the sites.txt table from the MagIC file.
ipmag.unpack_magic(magic_file_path,dir_path=directory, print_progress=False)
1  records written to file  /Users/penokean/0000_GitHub/PmagPy-docs/example_notebooks/template_notebooks/reversal_test_data/contribution.txt
1  records written to file  /Users/penokean/0000_GitHub/PmagPy-docs/example_notebooks/template_notebooks/reversal_test_data/locations.txt
214  records written to file  /Users/penokean/0000_GitHub/PmagPy-docs/example_notebooks/template_notebooks/reversal_test_data/sites.txt
214  records written to file  /Users/penokean/0000_GitHub/PmagPy-docs/example_notebooks/template_notebooks/reversal_test_data/samples.txt
214  records written to file  /Users/penokean/0000_GitHub/PmagPy-docs/example_notebooks/template_notebooks/reversal_test_data/specimens.txt
True
Import the sites table#
We can now use pandas to import the sites table to a pandas dataframe using the function pd.read_csv().
We need to point pd.read_csv() to the file which with the above steps has the location and name of 'reversal_test/sites.txt'. This can be changed if the file is in a different place or has a different name. For example, if it is in the same directory as the notebook it can be: 'sites.txt'
# change the sites_file path if you want to use a file in a different directory
sites_file = directory + '/sites.txt'
sites = pd.read_csv(sites_file,sep='\t',header=1)
sites.head()
| age_high | age_low | age_unit | citations | dir_dec | dir_inc | dir_tilt_correction | geologic_classes | geologic_types | height | lat | lithologies | location | lon | method_codes | site | vgp_lat | |
|---|---|---|---|---|---|---|---|---|---|---|---|---|---|---|---|---|---|
| 0 | 0 | 3 | Ma | 10.1016/j.quageo.2013.06.004 | 353.6 | 46.3 | 100 | Sedimentary | Sediment Layer | -0.0 | 40.15 | Silty Clay | Daodi Section, Nihewan Basin | 114.658333 | LP-DIR-T:DE-BFL | 0.0 | 76.399711 |
| 1 | 0 | 3 | Ma | 10.1016/j.quageo.2013.06.004 | 2.6 | 59.7 | 100 | Sedimentary | Sediment Layer | -2.3 | 40.15 | Silty Clay | Daodi Section, Nihewan Basin | 114.658333 | LP-DIR-T:DE-BFL | 2.3 | 87.978299 |
| 2 | 0 | 3 | Ma | 10.1016/j.quageo.2013.06.004 | 347.7 | 60.6 | 100 | Sedimentary | Sediment Layer | -3.3 | 40.15 | Silty Clay | Daodi Section, Nihewan Basin | 114.658333 | LP-DIR-T:DE-BFL | 3.3 | 80.596793 |
| 3 | 0 | 3 | Ma | 10.1016/j.quageo.2013.06.004 | 338.2 | 44.2 | 100 | Sedimentary | Sediment Layer | -4.3 | 40.15 | Silty Clay | Daodi Section, Nihewan Basin | 114.658333 | LP-DIR-T:DE-BFL | 4.3 | 66.955595 |
| 4 | 0 | 3 | Ma | 10.1016/j.quageo.2013.06.004 | 348.6 | 33.6 | 100 | Sedimentary | Sediment Layer | -5.0 | 40.15 | Silty Clay | Daodi Section, Nihewan Basin | 114.658333 | LP-DIR-T:DE-BFL | 5.0 | 66.113052 |
Filter by tilt correction#
When there are data in both geographic coordinates (without correction for bedding tilt) and data in tilt corrected coordinates, they each get their own row with different values in the dir_tilt_correction column:
0: No tilt correction applied. The data are in the geographic coordinate system (i.e., as they are currently oriented in the field).
100: Full (100%) tilt correction applied. The data are in the paleohorizontal coordinate system, meaning they have been corrected for tilting to represent their original horizontal position.
In the example dataset, only the tilt-corrected values are available. As a result, all the entries have a dir_tilt_correction of 100.
For completeness, we will filter and make a sites_geo dataframe where dir_tilt_correction is 0 and
a sites_tc dataframe where dir_tilt_correction is 100. For this example, sites_geo will be empty, but
it will be populated for a MagIC contribution where there are data in those coordinates.
sites_geo = sites[sites['dir_tilt_correction'] == 0]
sites_tc = sites[sites['dir_tilt_correction'] == 100]
Make declination/inclination lists#
We can extract specific columns from the dataframe by using the nomenclature dataframe_name['column_name']. In this case, we want to conduct a reversal test on the data in the sites_geo dataframe and are interested in the directional data which are the declination column dir_dec and the inclination column dir_inc. So using the code sites['dir_dec'] will give us all the declinations which we can assign to a variable sites_dec.
If you wanted to do the test on the sites_tc data, you would switch in sites_tc for sites_geo in the text below.
sites_dec = sites_tc['dir_dec']
sites_inc = sites_tc['dir_inc']
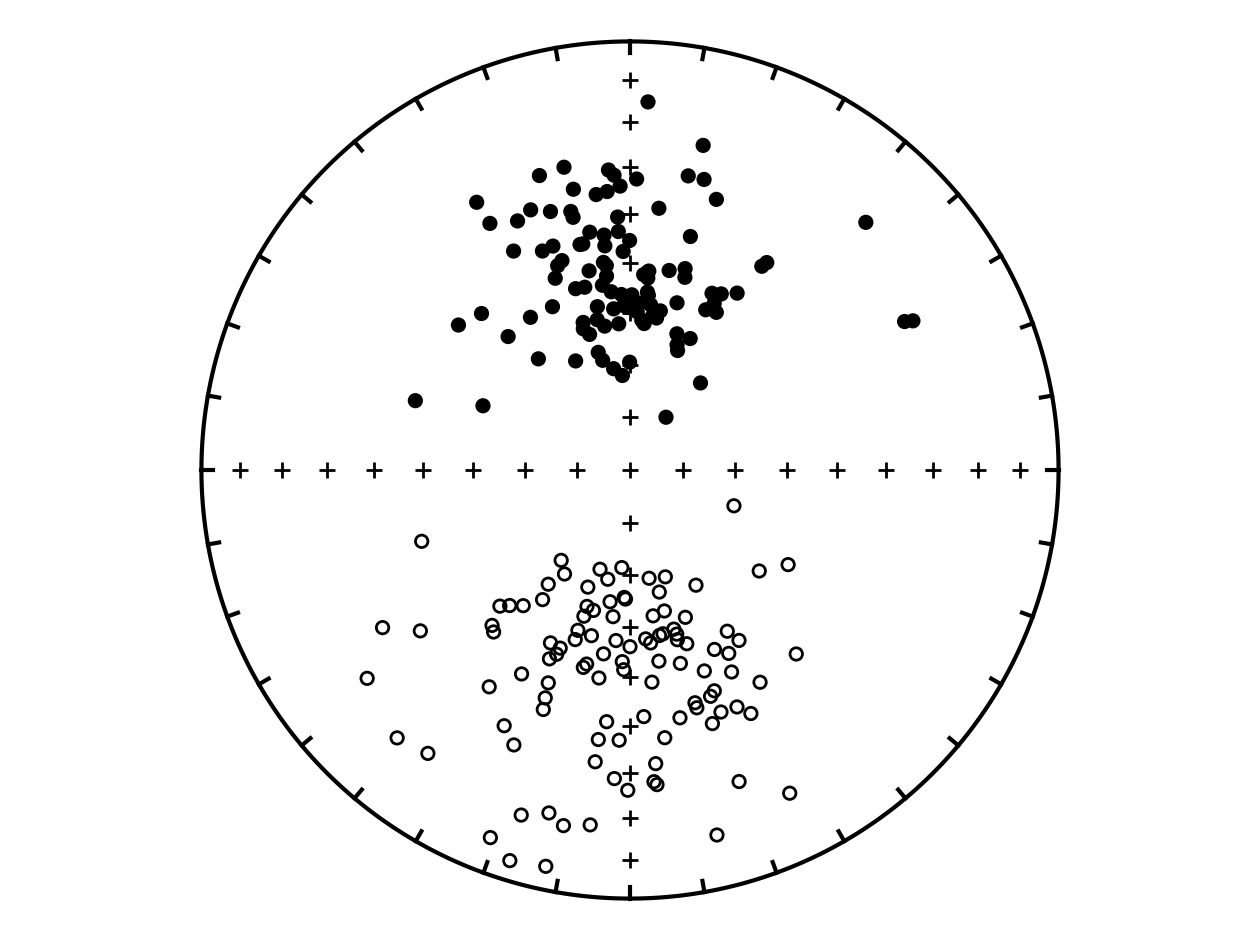
Plot the directions#
Reversal tests#
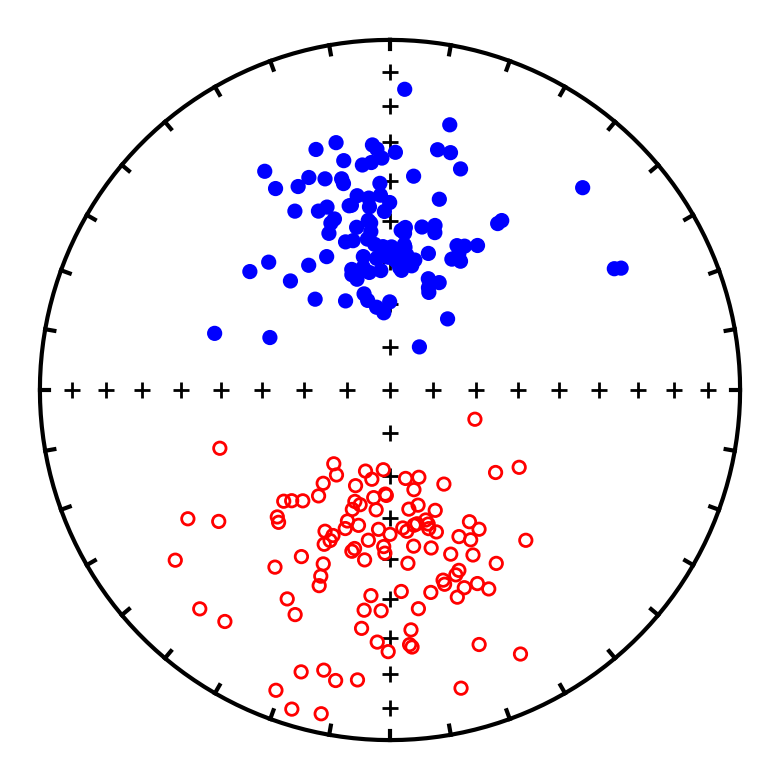
Now that we have extracted the declination and inclination values, let’s conduct reversal tests on these data using the functions ipmag.reversal_test_bootstrap and ipmag.reversal_test_MM1990.
Conduct the Watson common mean reversal test#
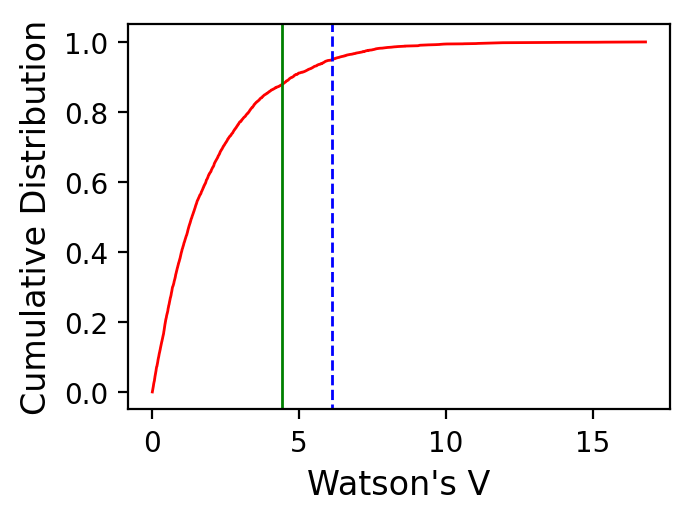
We can do the Watson common mean test (together with McFadden and McElhinny (1990) classification) as well:
ipmag.reversal_test_MM1990(dec=sites_dec,
                           inc=sites_inc,
                           plot_CDF=True)
Results of Watson V test:

Watson's V:           4.4
Critical value of V:  6.1
"Pass": Since V is less than Vcrit, the null hypothesis
that the two populations are drawn from distributions
that share a common mean direction can not be rejected.

M&M1990 classification:

Angle between data set means: 4.4
Critical angle for M&M1990:   5.1
The McFadden and McElhinny (1990) classification for
this test is: 'B'
(1, 4.362992887306586, 5.1420809705167825, 'B')
Conduct the classic Tauxe et al. (1991) bootstrap reversal test#
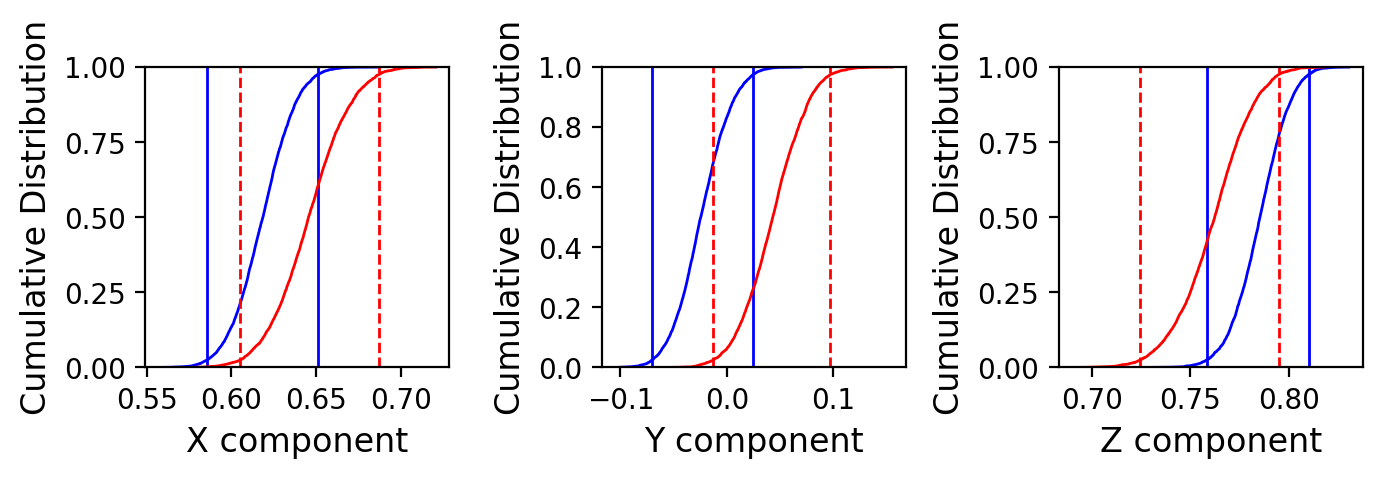
Let’s go ahead and do the bootstrap reversal test using this ipmag.reversal_test_bootstrap() function.
Apply the updated Heslop et al. (2023) bootstrap reversal test#
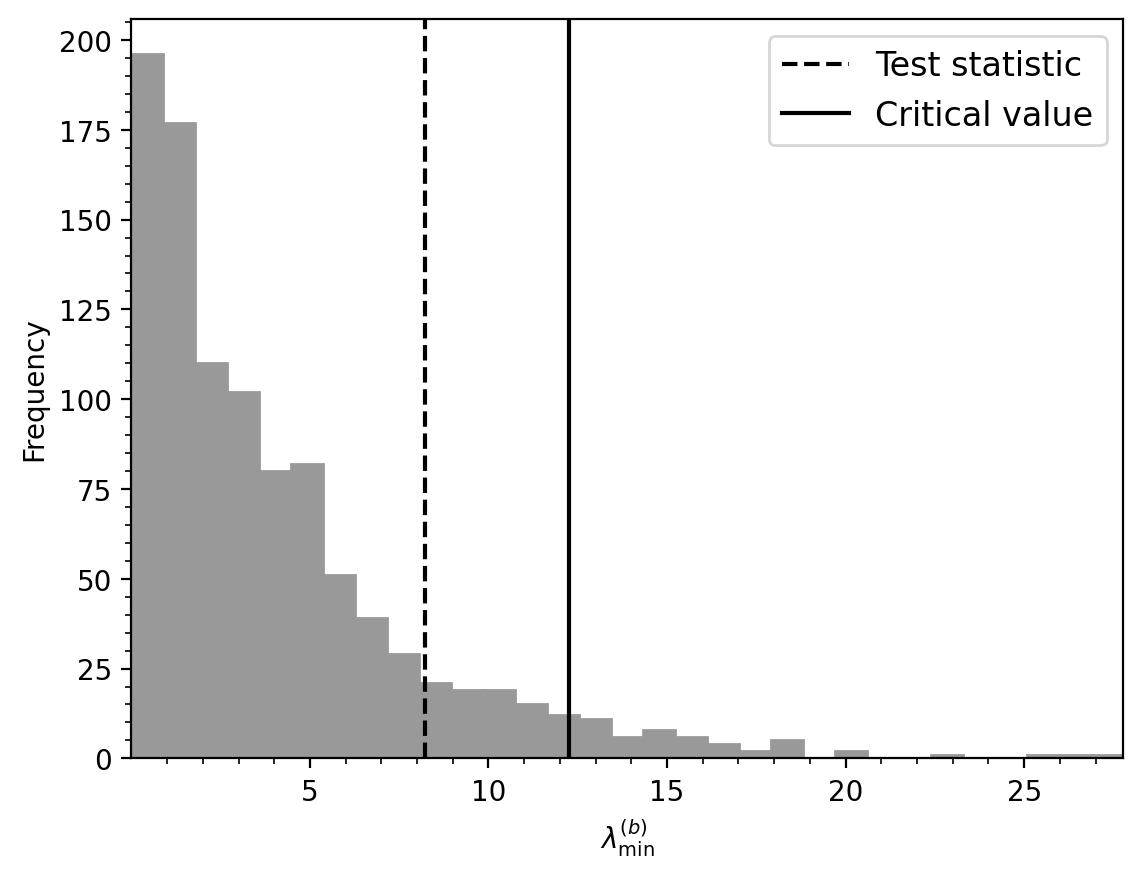
In the framework of the bootstrap reversal above Tauxe et al. (1991) inference comes from comparing the bootstrap-derived confidence regions for the mean directions. Heslop et al. (2023) updated the test and placed it within a null hypothesis significance testing framework. If the test statistic value is below a critical value, then the hypothesis that the populations share a common mean (for a reversal test that the antipode of one population shares a common mean with the other), cannot be rejected. In common parlance, such a result corresponds to “passing” a reversal test. In contrast, if the test statistic value exceeds the critical value the null hypothesis that the populations share a common mean can be rejected. In common parlance, such a result corresponds to “failing” a reversal test.
Learn about the reversal test functions#
To learn more about the functions, we can type the function with a question mark after them in a code cell (e.g. ipmag.reversal_test_bootstrap?). Doing so gives more information about the function and shows additional parameters that are available for customizing colors and symbols as well as saving output.
ipmag.reversal_test_bootstrap?
Signature:
ipmag.reversal_test_bootstrap(
    dec=None,
    inc=None,
    di_block=None,
    plot_stereo=False,
    color1='blue',
    color2='red',
    save=False,
    save_folder='.',
    fmt='svg',
)
Docstring:
Conduct a reversal test using bootstrap statistics (Tauxe, 2010) to
determine whether two populations of directions could be from an antipodal
common mean.

Parameters:
    dec: list of declinations
    inc: list of inclinations
    di_block: a nested list of [dec,inc]
        A di_block can be provided in which case it will be used instead of
        dec, inc lists.
    plot_stereo : before plotting the CDFs, plot stereonet with the
        bidirectionally separated data (default is False)
    save : boolean argument to save plots (default is False)
    save_folder : directory where plots will be saved (default is current directory, '.')
    fmt : format of saved figures (default is 'svg')

Returns:
    A boolean where 0 is fail and 1 is pass is returned.
    Plots of the cumulative distribution of Cartesian components are shown
    an equal area plot if `plot_stereo = True`.

Examples:
    Populations of roughly antipodal directions are developed here using
    ``ipmag.fishrot``. These directions are combined into a single di_block
    given that the function determines the principal component and splits the
    data accordingly by polarity.

    >>> directions_n = ipmag.fishrot(k=20, n=30, dec=5, inc=-60)
    >>> directions_r = ipmag.fishrot(k=35, n=25, dec=182, inc=57)
    >>> directions = directions_n + directions_r
    >>> ipmag.reversal_test_bootstrap(di_block=directions, plot_stereo = True)

    Data can also be input to the function as separate lists of dec and inc.
    In this example, the di_block from above is split into lists of dec and inc
    which are then used in the function:

    >>> direction_dec, direction_inc, direction_moment = ipmag.unpack_di_block(directions)
    >>> ipmag.reversal_test_bootstrap(dec=direction_dec,inc=direction_inc, plot_stereo = True)
File:      ~/0000_GitHub/PmagPy/pmagpy/ipmag.py
Type:      function
ipmag.reversal_test_bootstrap_H23?
Signature:
ipmag.reversal_test_bootstrap_H23(
    dec,
    inc,
    di_block=None,
    num_sims=10000,
    alpha=0.05,
    plot=True,
    save=False,
    save_folder='.',
    fmt='svg',
)
Docstring:
Bootstrap reversal test following Heslop et al. (2023).

This function calls common_mean_bootstrap_H23 with directional data that have been flipped,
for a reversal test. The directional data can be provided either as separate
declination and inclination arrays or as a di_block array.

Parameters:
    dec (array): Array of declinations, only considered if di_block is None.
    inc (array): Array of inclinations, only considered if di_block is None.
    di_block (array, optional): Directional data as [dec, inc] for each sample. If provided,
                                dec and inc are ignored.
    num_sims (int, optional): Number of bootstrap simulations. Default is 1000.
    alpha (float, optional): Significance level for hypothesis testing. Default is 0.05.
    plot (bool, optional): If True, produce a histogram plot of the test statistic. Default is True.
    save (bool, optional): If True, save the histogram plot. Default is False.
    save_folder (str, optional): Directory where the histogram plot will be saved. Default is the current directory.
    fmt (str, optional): File format for saving the histogram plot. Default is 'svg'.

Returns:
    tuple: Contains the following elements:
        - result (int): 0 if null hypothesis is rejected, 1 otherwise.
        - Lmin (float): The test statistic value.
        - Lmin_c (float): The critical test statistic value.
        - p (float): The p-value of the test.
File:      ~/0000_GitHub/PmagPy/pmagpy/ipmag.py
Type:      function
ipmag.reversal_test_MM1990?
Signature:
ipmag.reversal_test_MM1990(
    dec=None,
    inc=None,
    di_block=None,
    plot_CDF=False,
    plot_stereo=False,
    save=False,
    save_folder='.',
    fmt='svg',
)
Docstring:
Calculates Watson's V statistic from input files through Monte Carlo
simulation in order to test whether normal and reversed populations could
have been drawn from a common mean. Also provides the critical angle between
the two sample mean directions and the corresponding McFadden and McElhinny
(1990) classification. This function is a wrapper around the
ipmag.common_mean_watson() function with the first step of splitting
the data into two polarities using the pmag.flip() function and flipping
the reverse direction to their antipode.

 Parameters:
    dec (list, optional): List of declinations.
    inc (list, optional): List of inclinations.
    di_block (list of lists, optional): Nested list of [dec,inc]. If provided, it
        takes precedence over separate dec and inc lists.
    plot_CDF (bool, optional): If True, plot the CDF accompanying the results. Defaults to False.
    plot_stereo (bool, optional): If True, plot stereonet with bidirectionally separated data. Defaults to False.
    save (bool, optional): If True, save the plots. Defaults to False.
    save_folder (str, optional): Directory path for saving plots. Defaults to current directory.
    fmt (str, optional): Format of saved figures. Defaults to 'svg'.

Returns:
    result (bool): 0 indicates fail, 1 indicates pass.
    angle (float): Angle between the Fisher means of the two data sets.
    critical_angle (float): Critical angle for the test to pass.
    classification (str): MM1990 classification for a positive test.

Examples:
    Populations of roughly antipodal directions are developed here using
    ``ipmag.fishrot``. These directions are combined into a single di_block
    given that the function determines the principal component and splits the
    data accordingly by polarity.

    >>> directions_n = ipmag.fishrot(k=20, n=30, dec=5, inc=-60)
    >>> directions_r = ipmag.fishrot(k=35, n=25, dec=182, inc=57)
    >>> directions = directions_n + directions_r
    >>> ipmag.reversal_test_MM1990(di_block=directions, plot_stereo = True)

    Data can also be input to the function as separate lists of dec and inc.
    In this example, the di_block from above is split into lists of dec and inc
    which are then used in the function:

    >>> direction_dec, direction_inc, direction_moment = ipmag.unpack_di_block(directions)
    >>> ipmag.reversal_test_MM1990(dec=direction_dec,inc=direction_inc, plot_stereo = True)
File:      ~/0000_GitHub/PmagPy/pmagpy/ipmag.py
Type:      function

