An essential part of every paleomagnetic study is a discussion of what is carrying the magnetic remanence and how the rocks got magnetized. For this, we need some knowledge of what the important natural magnetic phases are, how to identify them, how they formed, and what their magnetic behavior is. In this chapter, we will cover a brief description of geologically important magnetic phases. Useful magnetic characteristics of important minerals can be found in Table 6.1 at the end of this chapter.
Iron is by far the most abundant transition element in the solar system, so most paleomagnetic studies depend on the magnetic iron bearing minerals: the iron-nickels (which are particularly important for extra-terrestrial magnetic studies), the iron-oxides such as magnetite, maghemite and hematite, the iron-oxyhydroxides such as goethite and ferrihydrite, and the iron-sulfides such as greigite and pyrrhotite. We are concerned here with the latter three as iron-nickel is very rare in terrestrial paleomagnetic studies.
6.1Iron-oxides
The minerals we will be discussing are mostly solid solutions which the American Heritage dictionary defines as:
A homogeneous crystalline structure in which one or more types of atoms or molecules may be partly substituted for the original atoms and molecules without changing the structure.
In iron oxides, titanium commonly substitutes for iron in the crystal structure. Because the titanium ion Ti has no unpaired spins (see Chapter 3) and is a different size, the magnetic properties of titano-magnetite are different from magnetite with no titanium.
Two solid solution series are particularly important in paleomagnetism: the ulvöspinel-magnetite and ilmenite-hematite series. Both titanomagnetites and hemoilmenites crystallize at about 1300°C. Above about 600°C, there is complete solid solution between magnetite and ulvöspinel and above about 800°C between hematite and ilmenite. This means that all compositions are “allowed” in the crystal structure at the crystallization temperature. As the temperature decreases, the thermodynamic stability of the crystals changes. If a mineral has a given composition, say 60% titanium substitution (green dot in Figure 6.1a), when the temperature cools to intersect the red line, that composition is no longer thermodynamically stable and the two phases to either side are the equilibrium compositions. By 400°C the two equilibrium phases are ~0.25 and ~0.9 Ti substitution. To achieve the separation, the cations diffuse through the crystal leaving titanium richer and titanium poorer bands called lamellae (see Figure 6.2). Exsolution is inhibited if the crystals cool rapidly so there are many metastable crystals with non-equilibrium values of titanium substitution in nature.
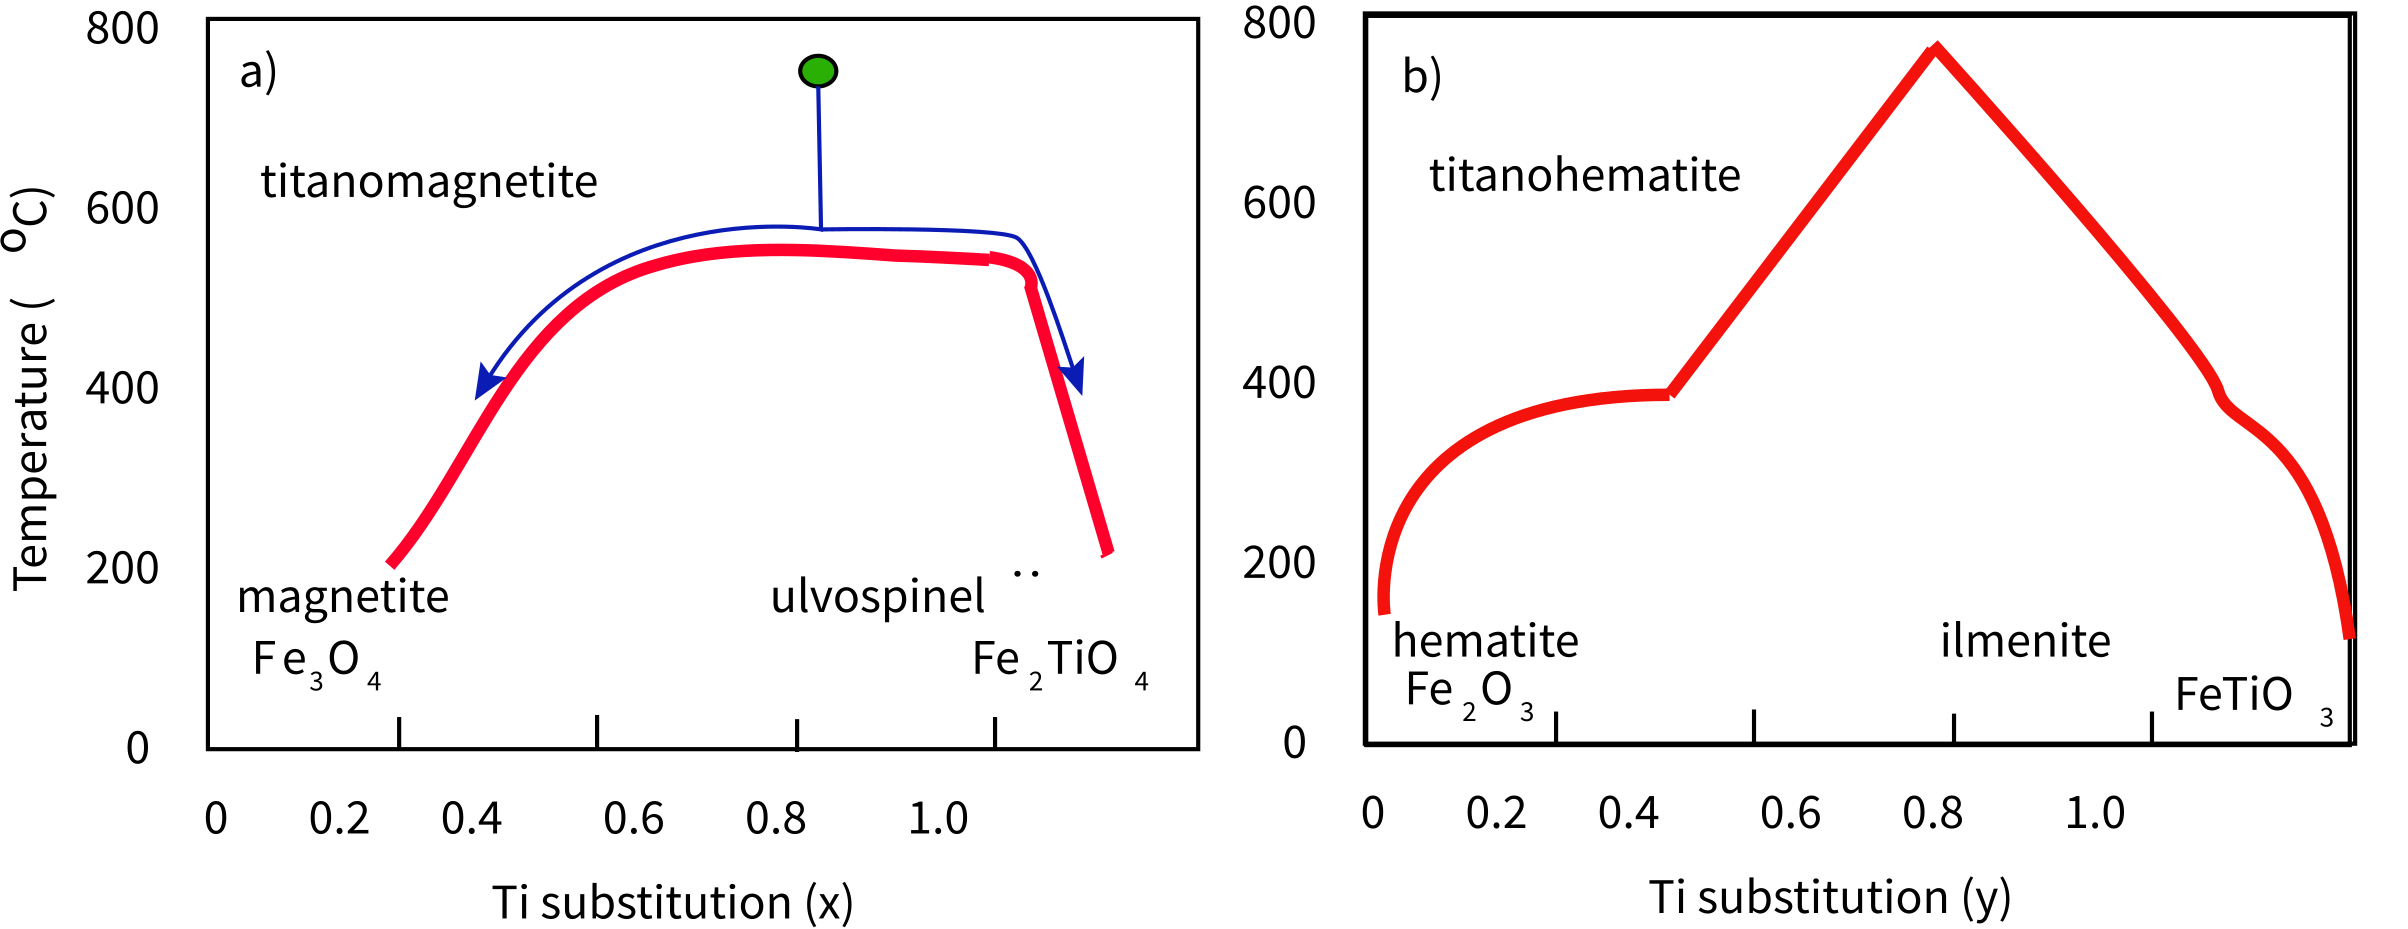
Figure 6.1:Phase diagrams for FeTi oxides. The composition is indicated by or . There is complete solid solution above the solid lines. Exsolution begins as the temperature cools below the solid curves. a) Titanomagnetite series. [Redrawn from Nagata (1961).] b) Titanohematite series. [Redrawn from Robinson et al. (2004).]
Exsolution is important in paleomagnetism for two reasons. First, the different compositions have very different magnetic properties. Second, the lamellae effectively reduce the magnetic crystal size which we already know has a profound influence on the magnetic stability of the mineral. An example of this is shown in Figure 6.2b in which the larger crystal is several microns in width, too large to have single domain-like magnetization, yet the smaller magnetite lamellae are indeed small enough and carry a strong stable magnetization Feinberg et al. (2005).
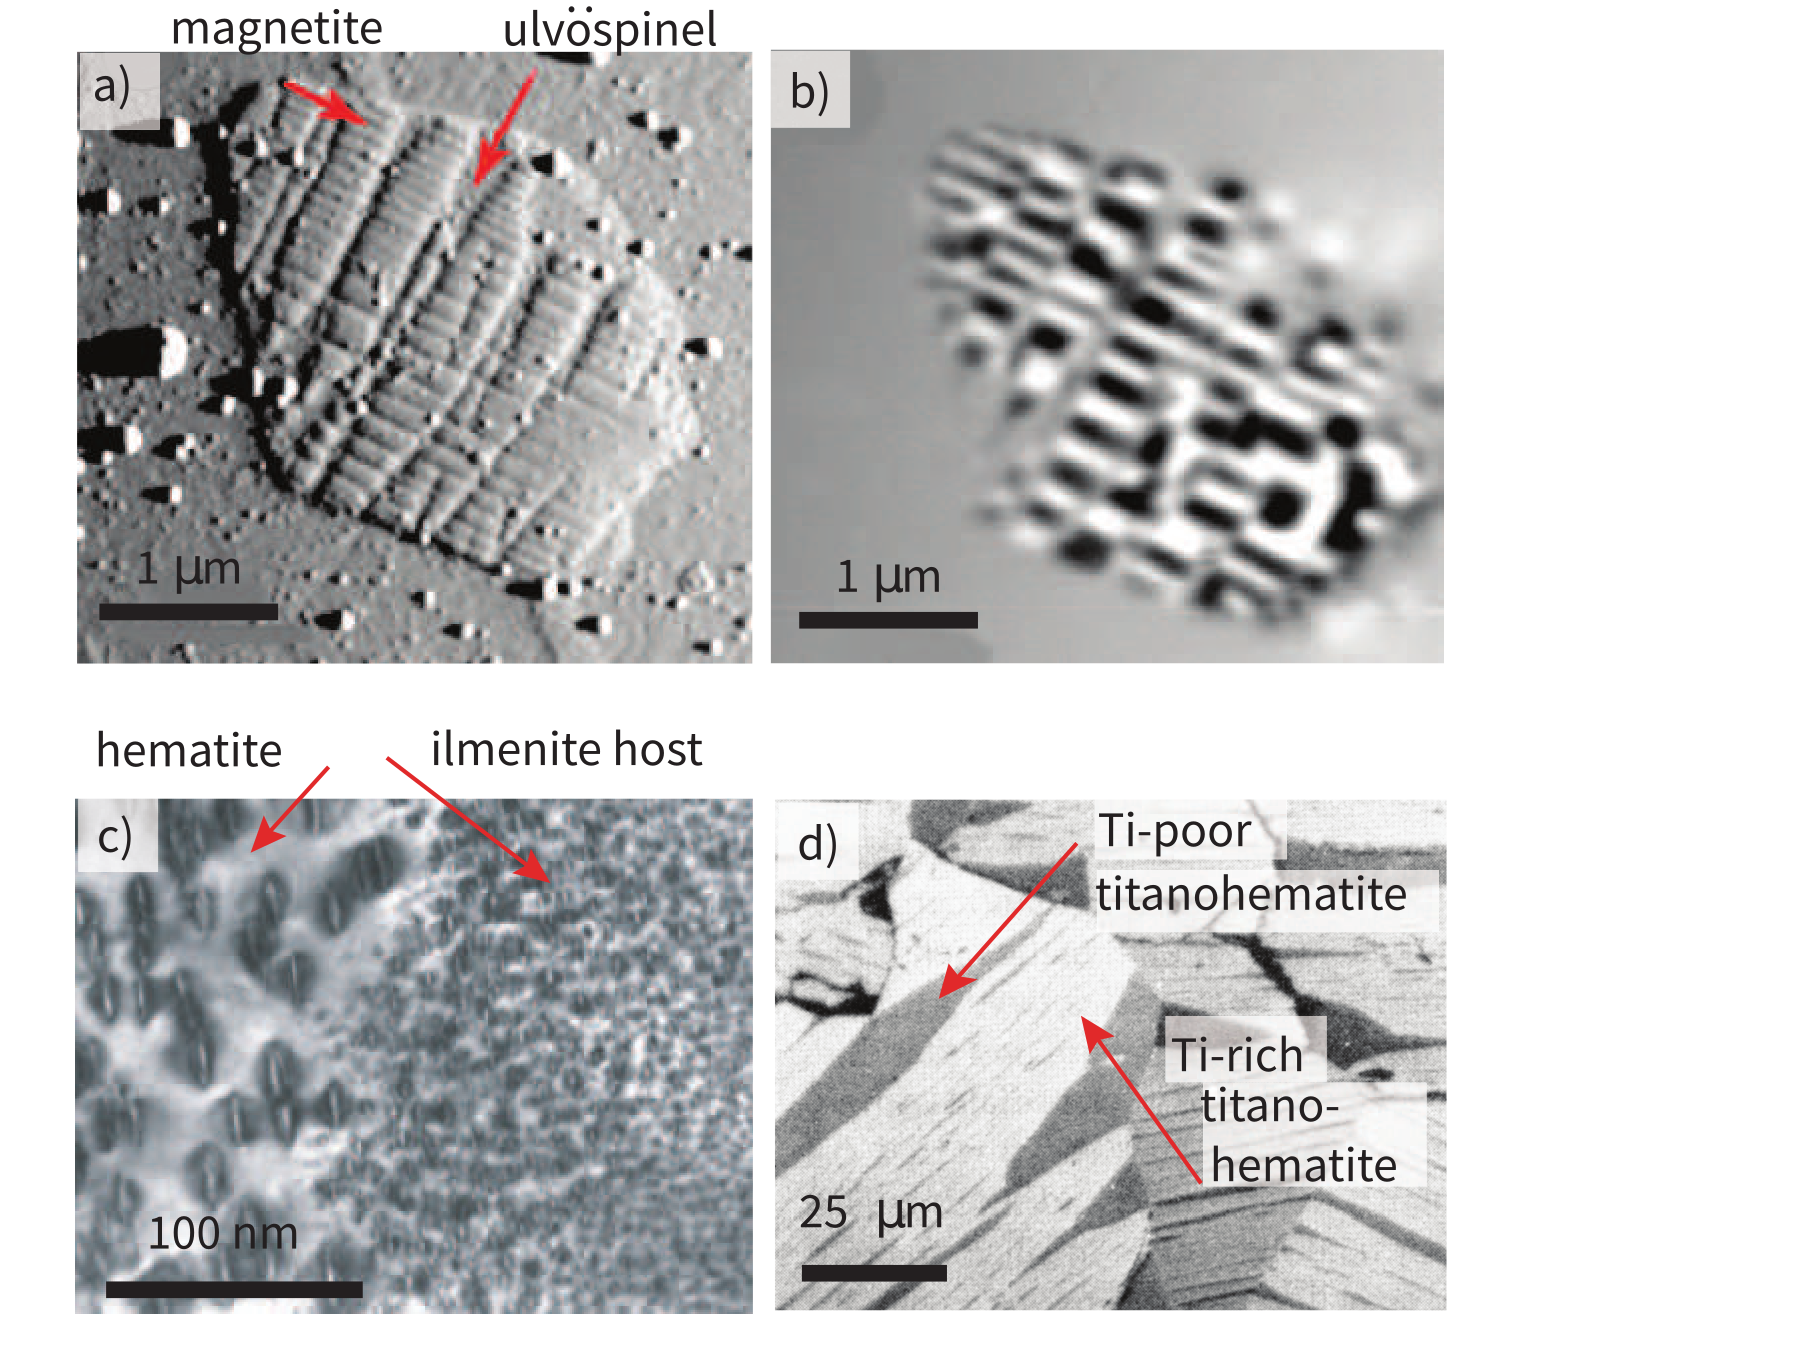
Figure 6.2:a) Atomic force micrograph image of magnetite inclusion in clinopyroxene. The topographically low areas are ulvöspinel while the higher areas are magnetite. b) Magnetic force micrograph of magnetic domains (black and white are oppositely magnetized). The ulvöspinel lamellae are essentially non-magnetic and are gray. c) Transmission electron micrograph of ilmenite host with hematite exsolution lamellae. Lamellar size gets smaller with proximity to edge. d) Photomicrograph of titanohematite exsolution lamellae. Dark bands are Ti-rich (high magnetization, low ), light grey bands are Ti-poor (low magnetization, high ). [a and b are from Feinberg et al. (2005), c) from Robinson et al. (2002), d) is modified from S. Haggerty in Butler (1992).]
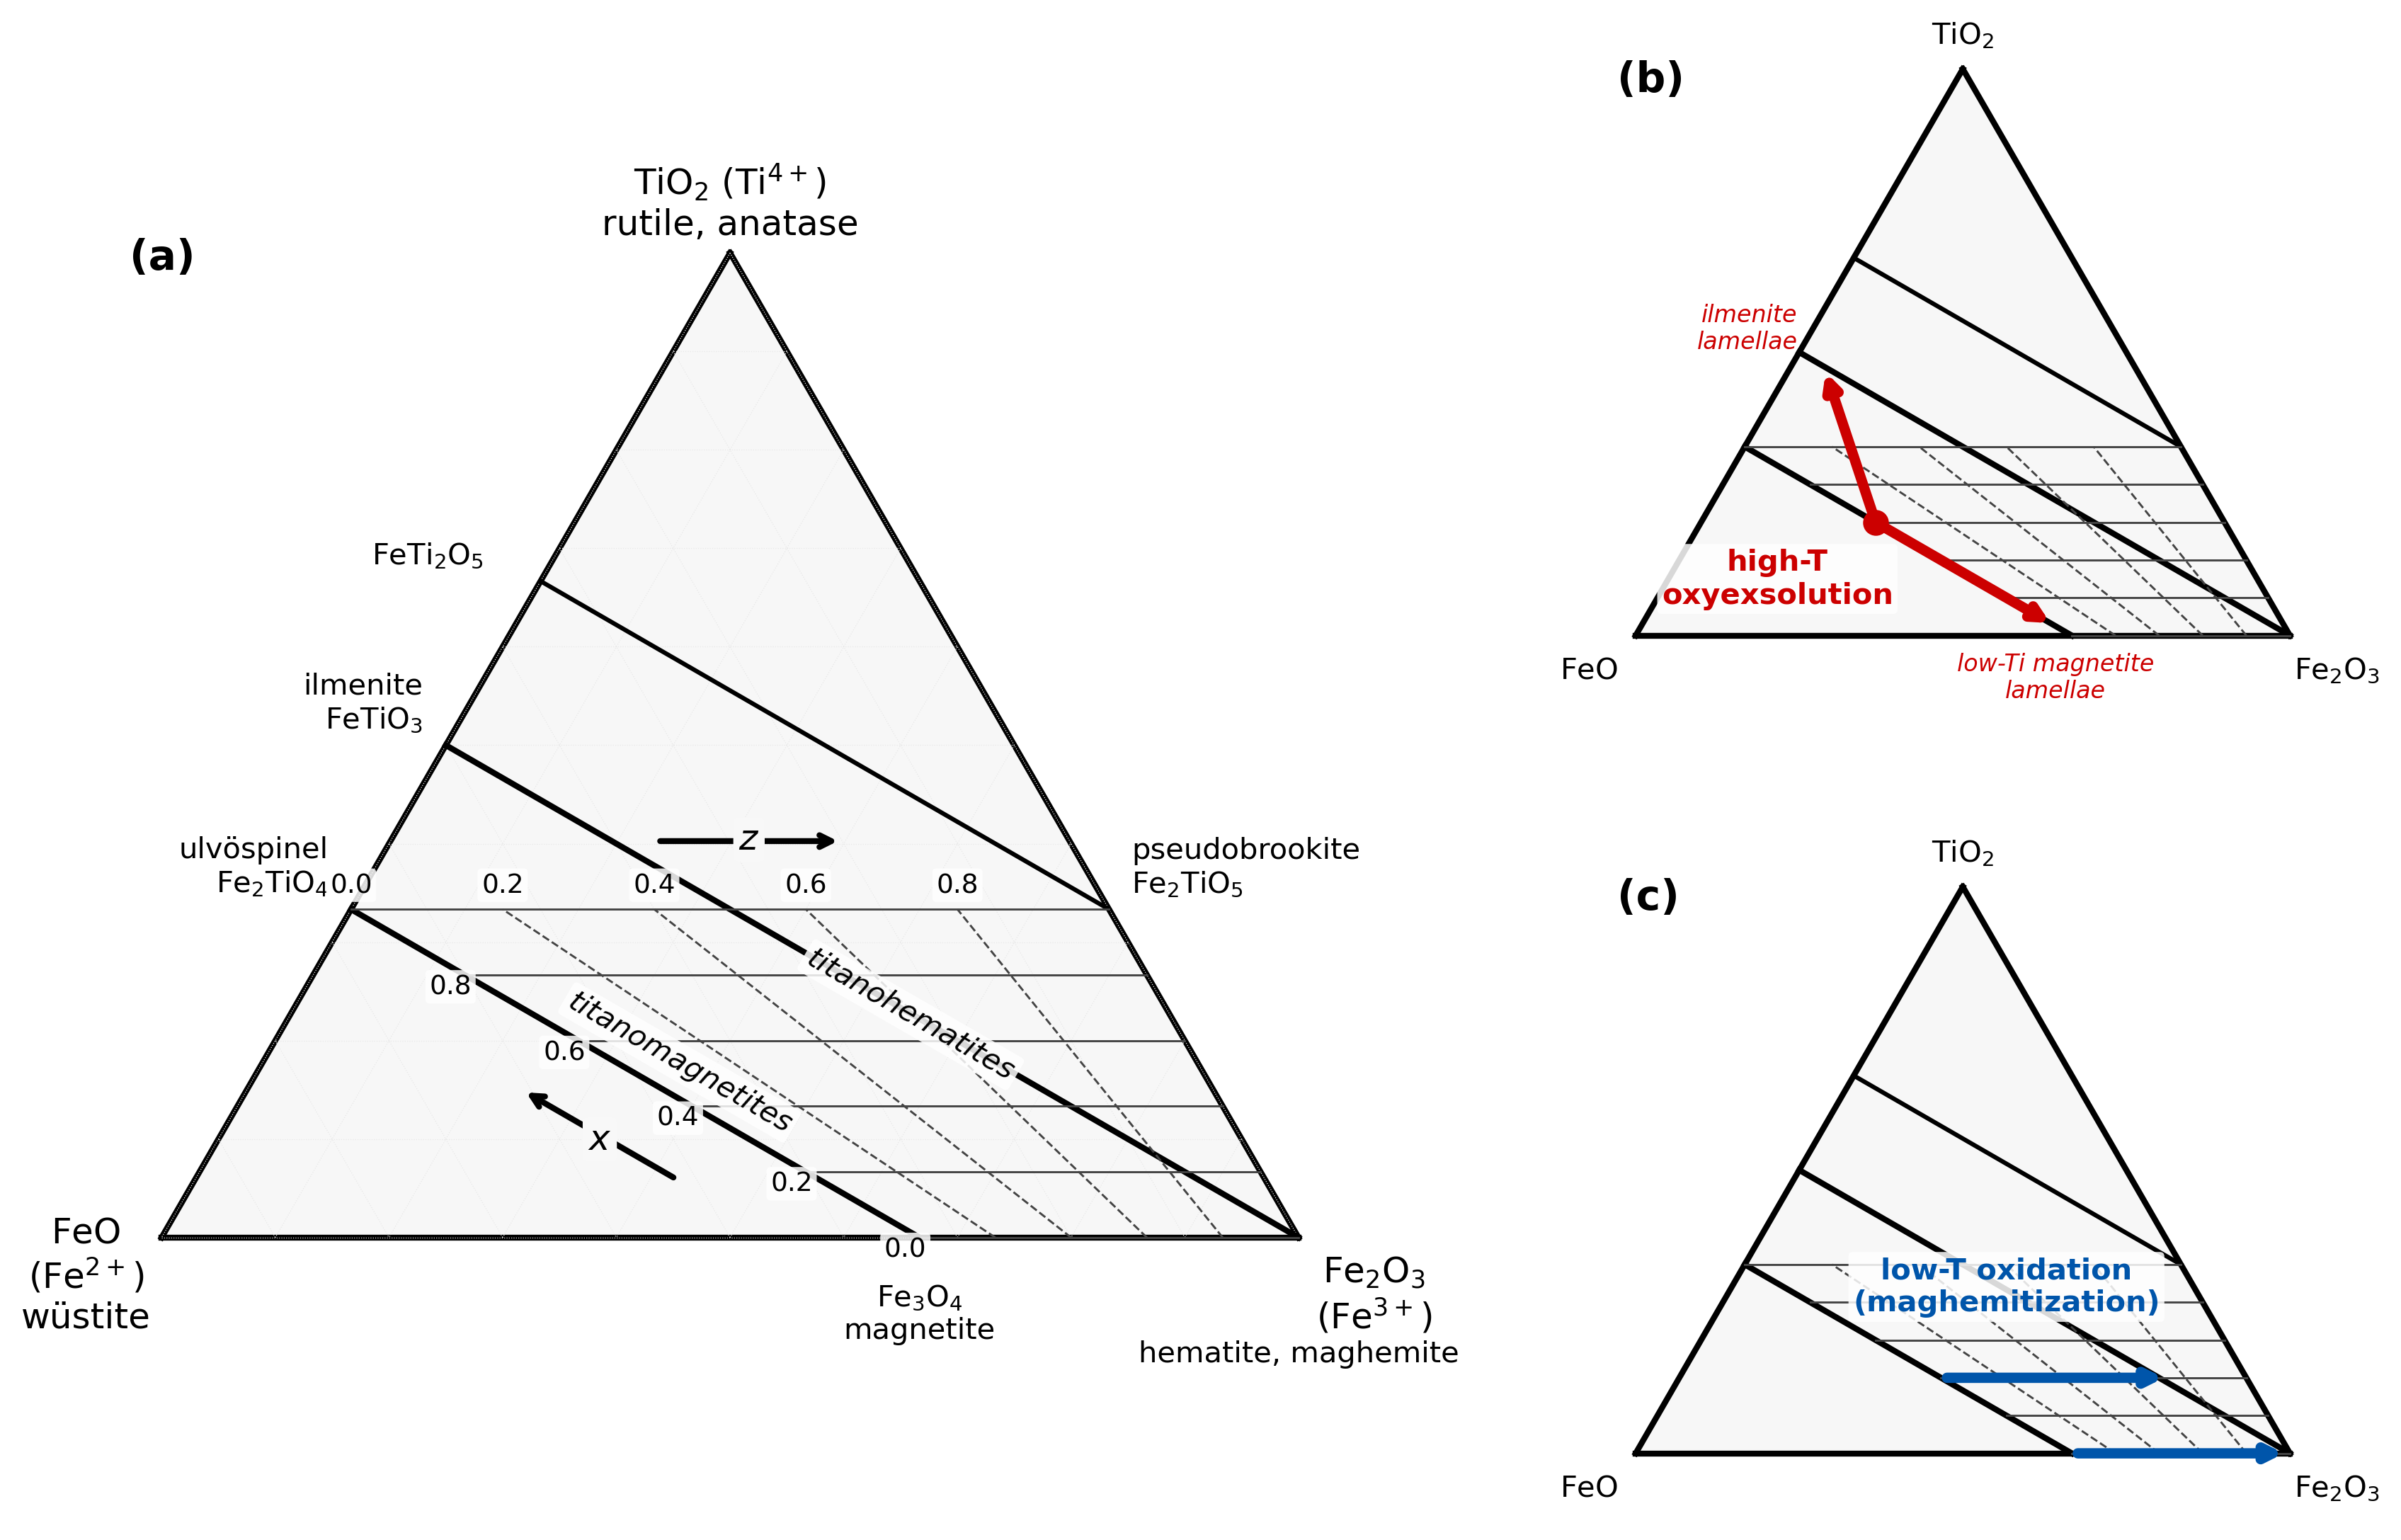
Figure 6.3:Cation-fraction ternary diagram (Fe–Ti–Fe) for the Fe–Ti oxide system. Solid lines show the titanomagnetite and titanohematite solid-solution series with increasing titanium substitution (). Dashed lines with arrows indicate the direction of increasing oxidation (). Panel (b) illustrates high-temperature oxyexsolution of titanomagnetite into magnetite-rich and ilmenite-rich lamellae, conserving bulk composition. Panel (c) shows low-temperature oxidation (maghemitization), which increases Fe at approximately constant Ti.
Compositions of minerals are frequently plotted on ternary diagrams like the one shown in Figure 6.3. [For help in reading ternary diagrams, please see the Appendix.] The apices of the ternary diagram are Fe on the lower left, Fe on the lower right and Ti on the top. The oxides with these species are FeO (wüstite), FeO (hematite or maghemite depending on structure) and TiO (rutile). Every point on the triangle represents a cation mixture or solution that adds up to one cation (hence the fractional formulae).
Each of the solid arrows in Figure 6.3 (labelled titanomagnetite and hemoilmenite) represent increasing substitution of titanium into the crystal lattices of magnetite and hematite respectively. The amount of Ti substitution in titanomagnetites is denoted by “”, while substitution in the hemoilmenites is denoted by “”. Values for and range from 0 (magnetite or hematite) to 1 (ulvöspinel or ilmenite).
6.1.1Titanomagnetites FeTiO
In earlier chapters on rock magnetism, we learned a few things about magnetite. As mentioned in Chapter 4, magnetite (FeO) has an inverse spinel structure (ABO). The oxygen atoms form a face-centered cubic lattice into which cations fit in either octahedral or tetrahedral symmetry. For each unit cell there are four tetrahedral sites (A) and eight octahedral sites (B). To maintain charge balance with the four oxygen ions (O), there are two Fe ions and one Fe ion. Fe has five unpaired spins, while Fe has four. As discussed in Chapter 3, each unpaired spin contributes a moment of one Bohr magneton (). The divalent iron ions all reside in the octahedral lattice sites, whereas the trivalent iron ions are split evenly between octahedral and tetrahedral sites: FeFeFeO. The A and B lattice sites are coupled with antiparallel spins and magnetite is ferrimagnetic. Therefore, the net moment of magnetite is (9-5=4) per molecule (at 0 K).
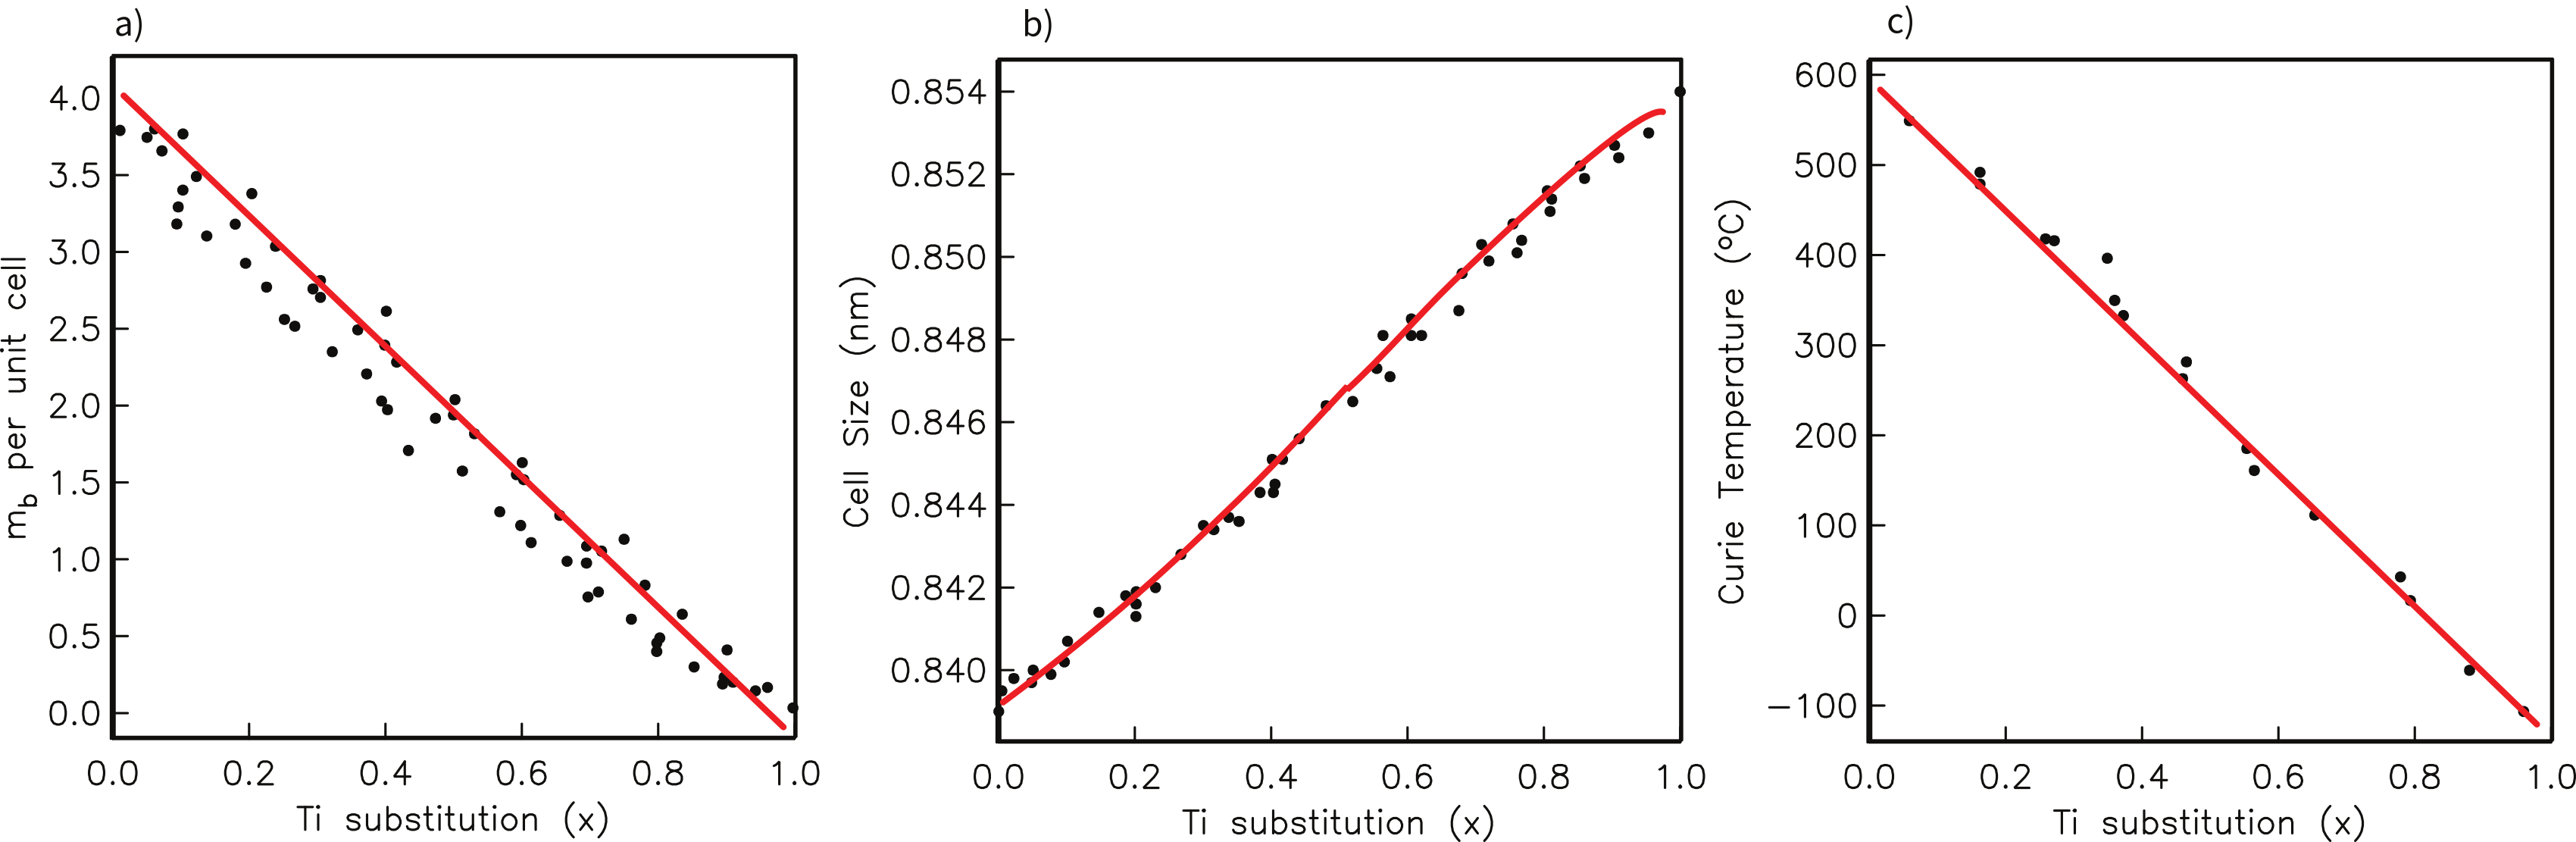
Figure 6.4:Variation of intrinsic parameters with titanium substitution in the titanomagnetite lattice. X is the degree of substitution from 0 (no Ti) to 1 (100% substitution). a) Variation of the magnetization expressed as Bohr magnetons per unit cell. b) Variation of cell lattice size. c) Variation of Curie temperature. [Data compiled by O'Reilly (1984).]
Titanomagnetites can occur as primary minerals in igneous rocks. Magnetite, as well as various members of the hemoilmenite series, can also form as a result of high temperature oxidation. In sediments, magnetite often occurs as a detrital component. It can also be produced by bacteria or authigenically during diagenesis.
Substitution of Ti, which has no unpaired spins (see Chapter 3), has a profound effect on the magnetic properties of the resulting titanomagnetite. Ti substitutes for a trivalent iron ion. In order to maintain charge balance, another trivalent iron ion turns into a divalent iron ion. The end members of the solid solution series are:
| magnetite | ulvöspinel |
|---|---|
| Fe$^{3+} | ^{3+}^{2+} |
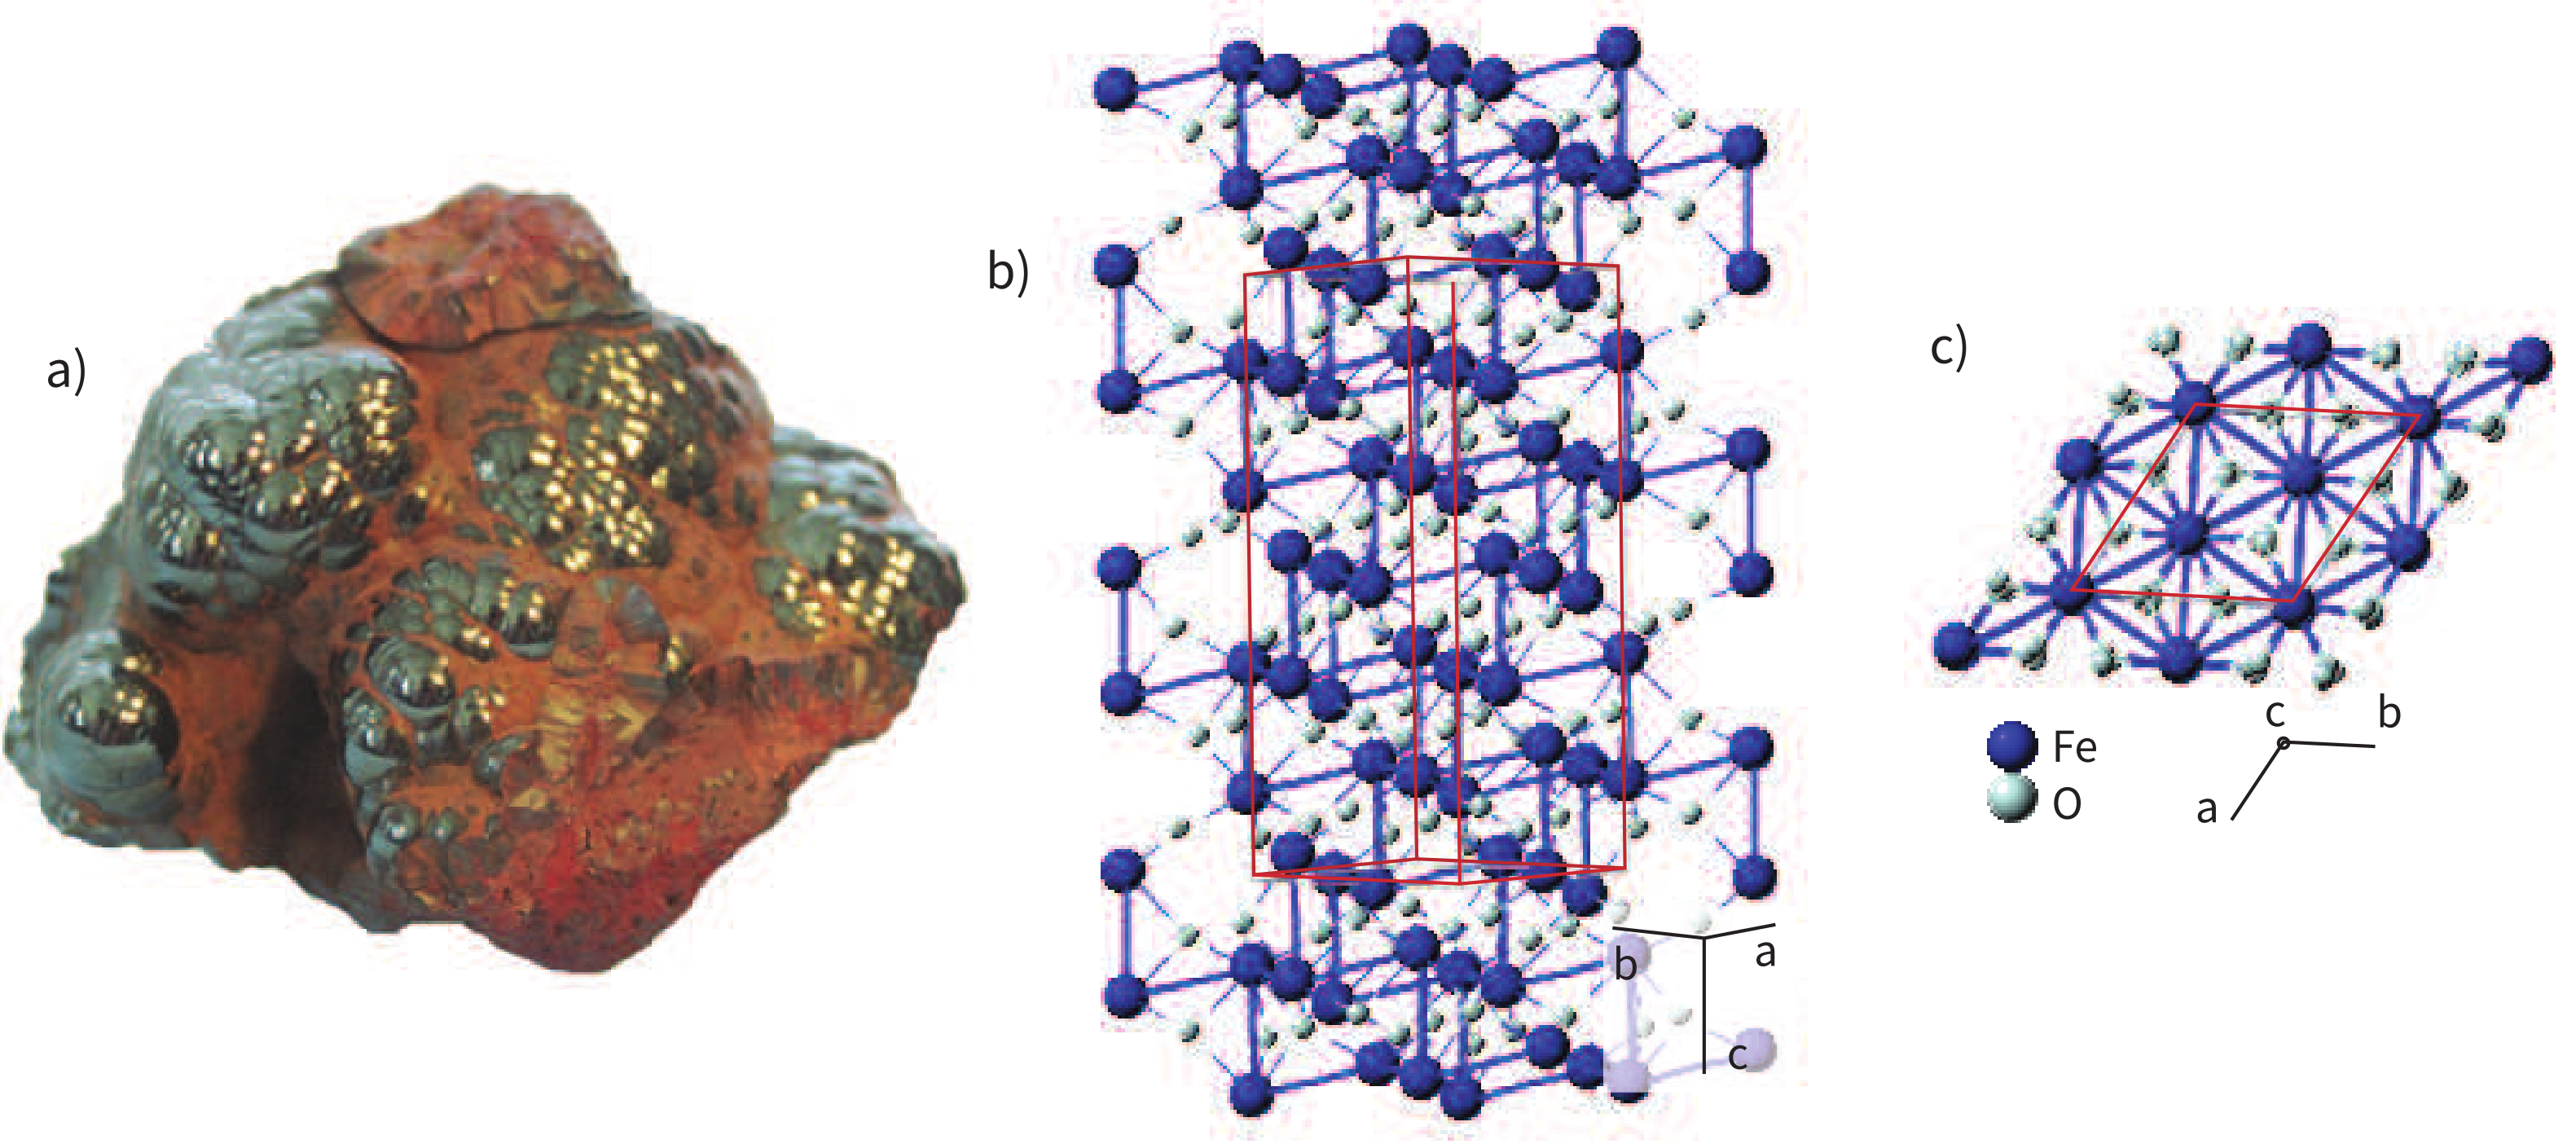
Figure 6.5:Hematite. a) Photograph of Kidney ore hematite from Michigan by DanielCD. [From commons
Ulvöspinel is antiferromagnetic because the A and B lattice sites have the same net moment. When is between 0 and 1, the mineral is called a titanomagnetite. If is 0.6, for example, the mineral is called TM60 (green dot in Figure 6.3).
The profound effect of titanium substitution on the intrinsic properties of titanomagnetite is illustrated in Figure 6.4. Because Ti has no unpaired spins, the saturation magnetization decreases with increasing (Figure 6.4a). The cell dimensions increase with increasing (Figure 6.4b). As a result of the increased cell dimension, there is a decrease in Curie Temperature (Figure 6.4c). There is also a slight increase in coercivity (not shown).
The large of magnetite (see Table 6.1) means that for deviations from equant grains as small as 10%, the magnetic anisotropy energy becomes dominated by shape. Nonetheless, aspects of the magnetocrystalline anisotropy provide useful diagnostic tests. The magnetocrystalline anisotropy constants are a strong function of temperature. On warming to ~120 K (~-150°C) from near absolute zero, changes in these constants can lead to an abrupt loss of magnetization, which is known loosely as the Verwey transition (see Chapter 4). Identification of the Verwey transition suggests a remanence that is dominated by magnetocrystalline anisotropy. As we shall see, the temperature at which it occurs is sensitive to oxidation and the transition can be completely suppressed by maghemitization (see Dunlop & Özdemir (1997)).
It should be noted that natural titanomagnetites often contain impurities (usually Al, Mg, Cr). These impurities also affect the magnetic properties. Substitution of 0.1 Al into the unit cell of titanomagnetite results in a 25% reduction in and a reduction of the Curie temperature by some 50°C. Substitution of Mg into TM60 also results in a lower saturation magnetization with a reduction of some 15%.
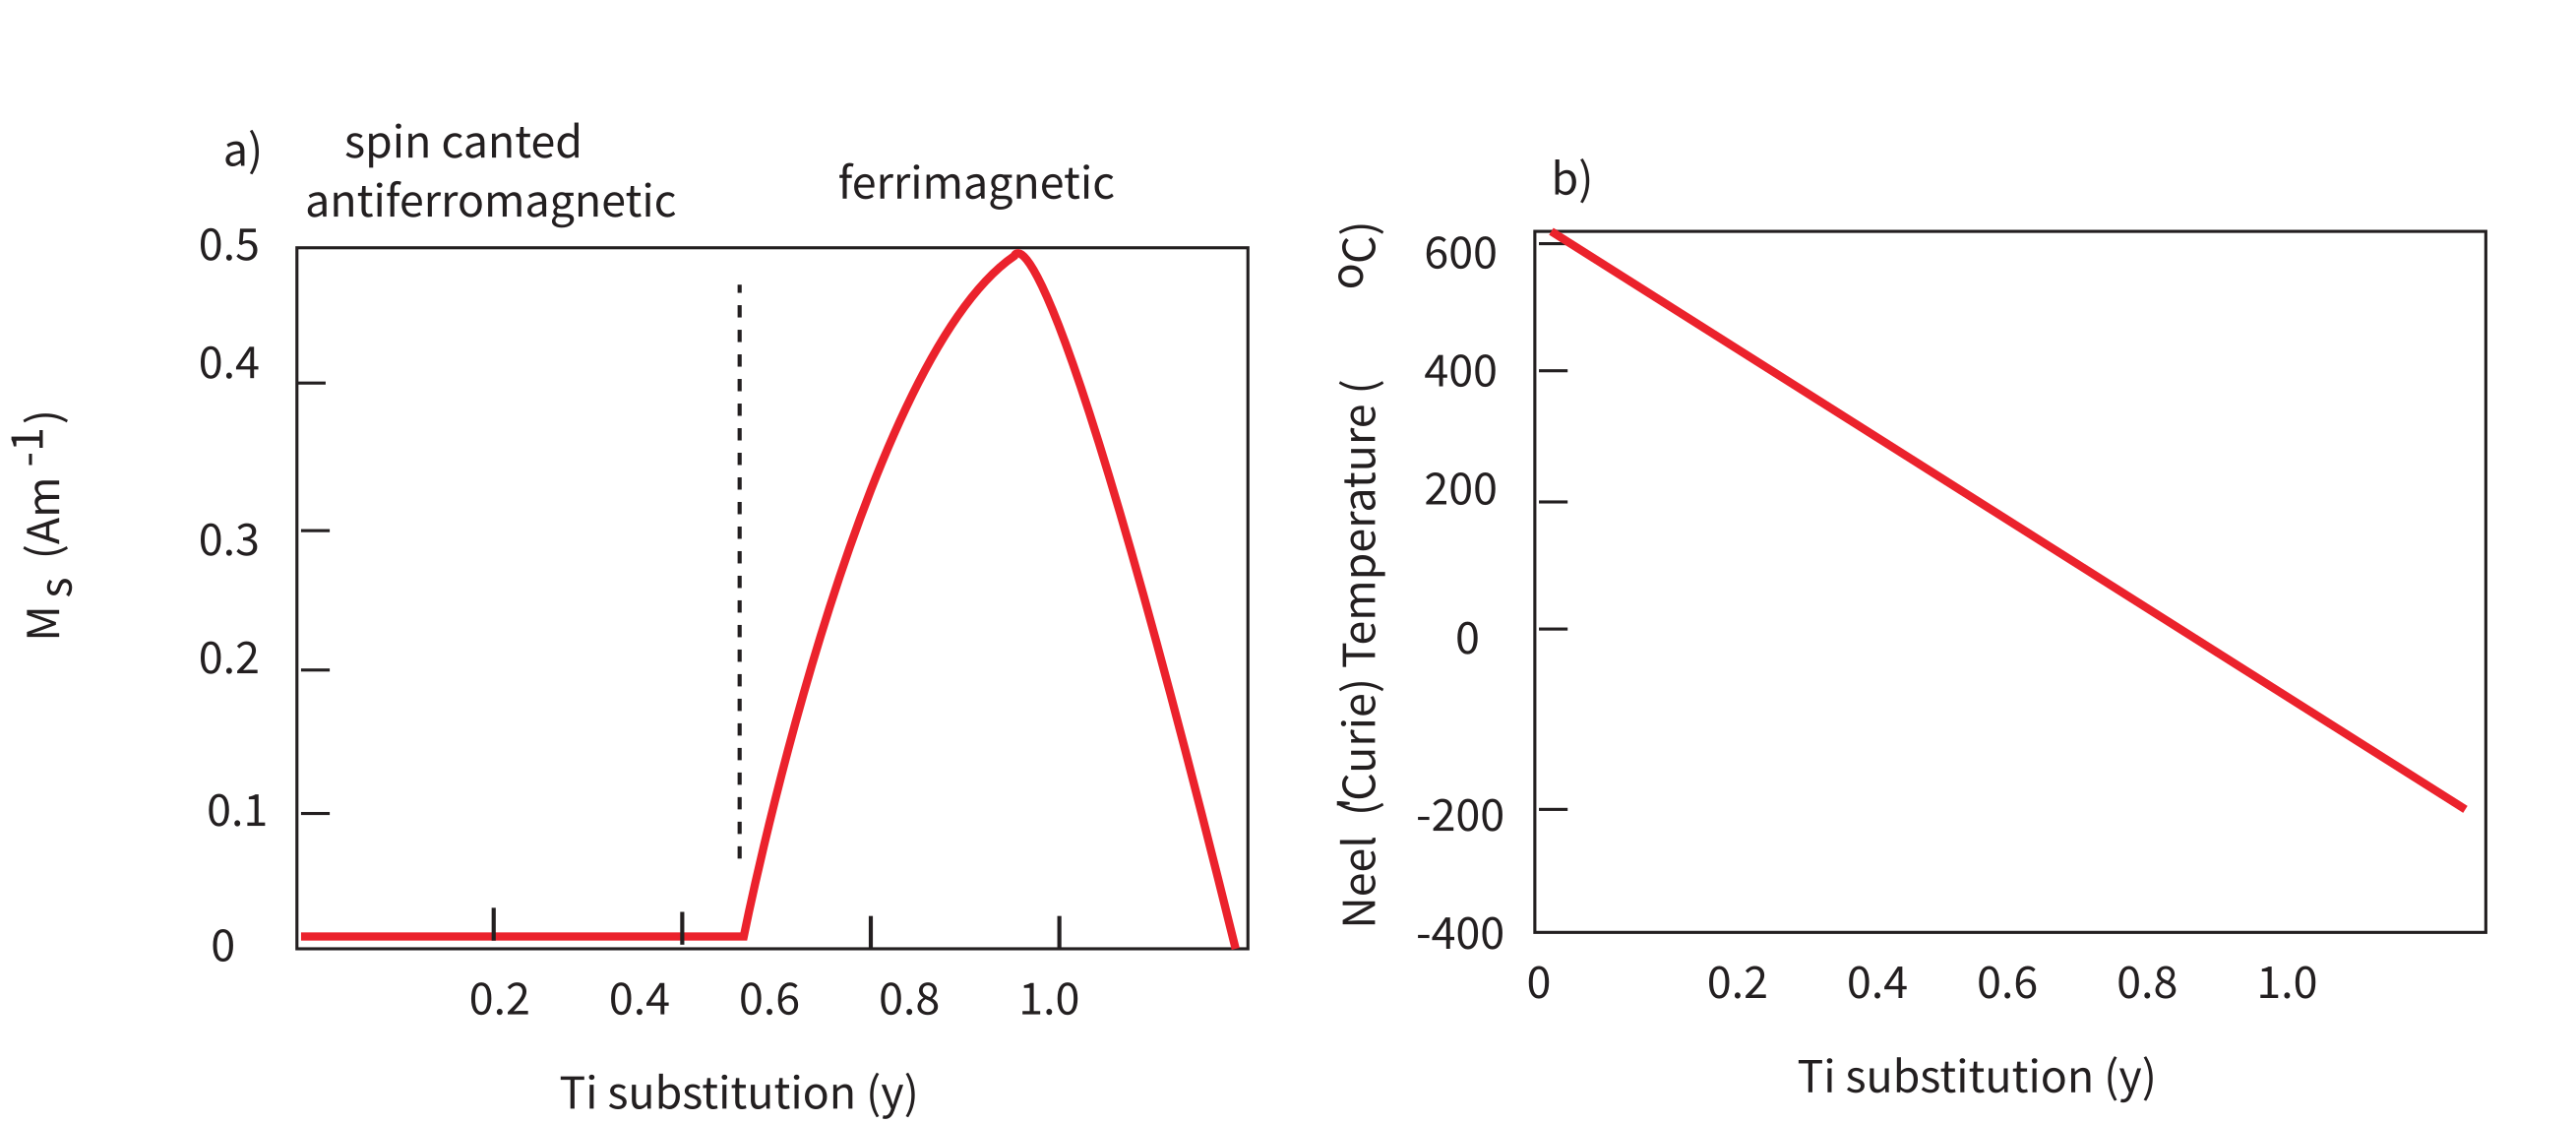
Figure 6.6:Variation of properties with Ti substitution in the titanohematite series. a) Variation of saturation magnetization. b) Variation of Néel Temperature. [Modified from Nagata (1961) and Stacey & Banerjee (1974).]
6.1.2Hematite-Ilmenite FeTiO
Hematite has a corundum structure (see Figure 6.5). It is rhombohedral with a pseudocleavage (perpendicular to the axis) and tends to break into flakes. It is antiferromagnetic, with a weak parasitic ferromagnetism resulting from either spin-canting or defect ferromagnetism (see Chapter 3). Because the magnetization is a , The temperature at which hematite’s spin-canted antiferromagnetism disapears (the Néel Temperature) is approximately 685°C.
Above about -10°C (the Morin transition), the magnetization is constrained by aspects of the crystal structure to lie perpendicular to the axis or within the basal plane. Below the Morin transition, spin-canting all but disappears and the magnetization is parallel to the axis. This effect could be used to demagnetize the grains dominated by spin-canting: it does not affect those dominated by defect moments. Most hematites formed at low-temperatures have magnetizations dominated by defect moments, so the remanence of many rocks will not display a Morin transition.
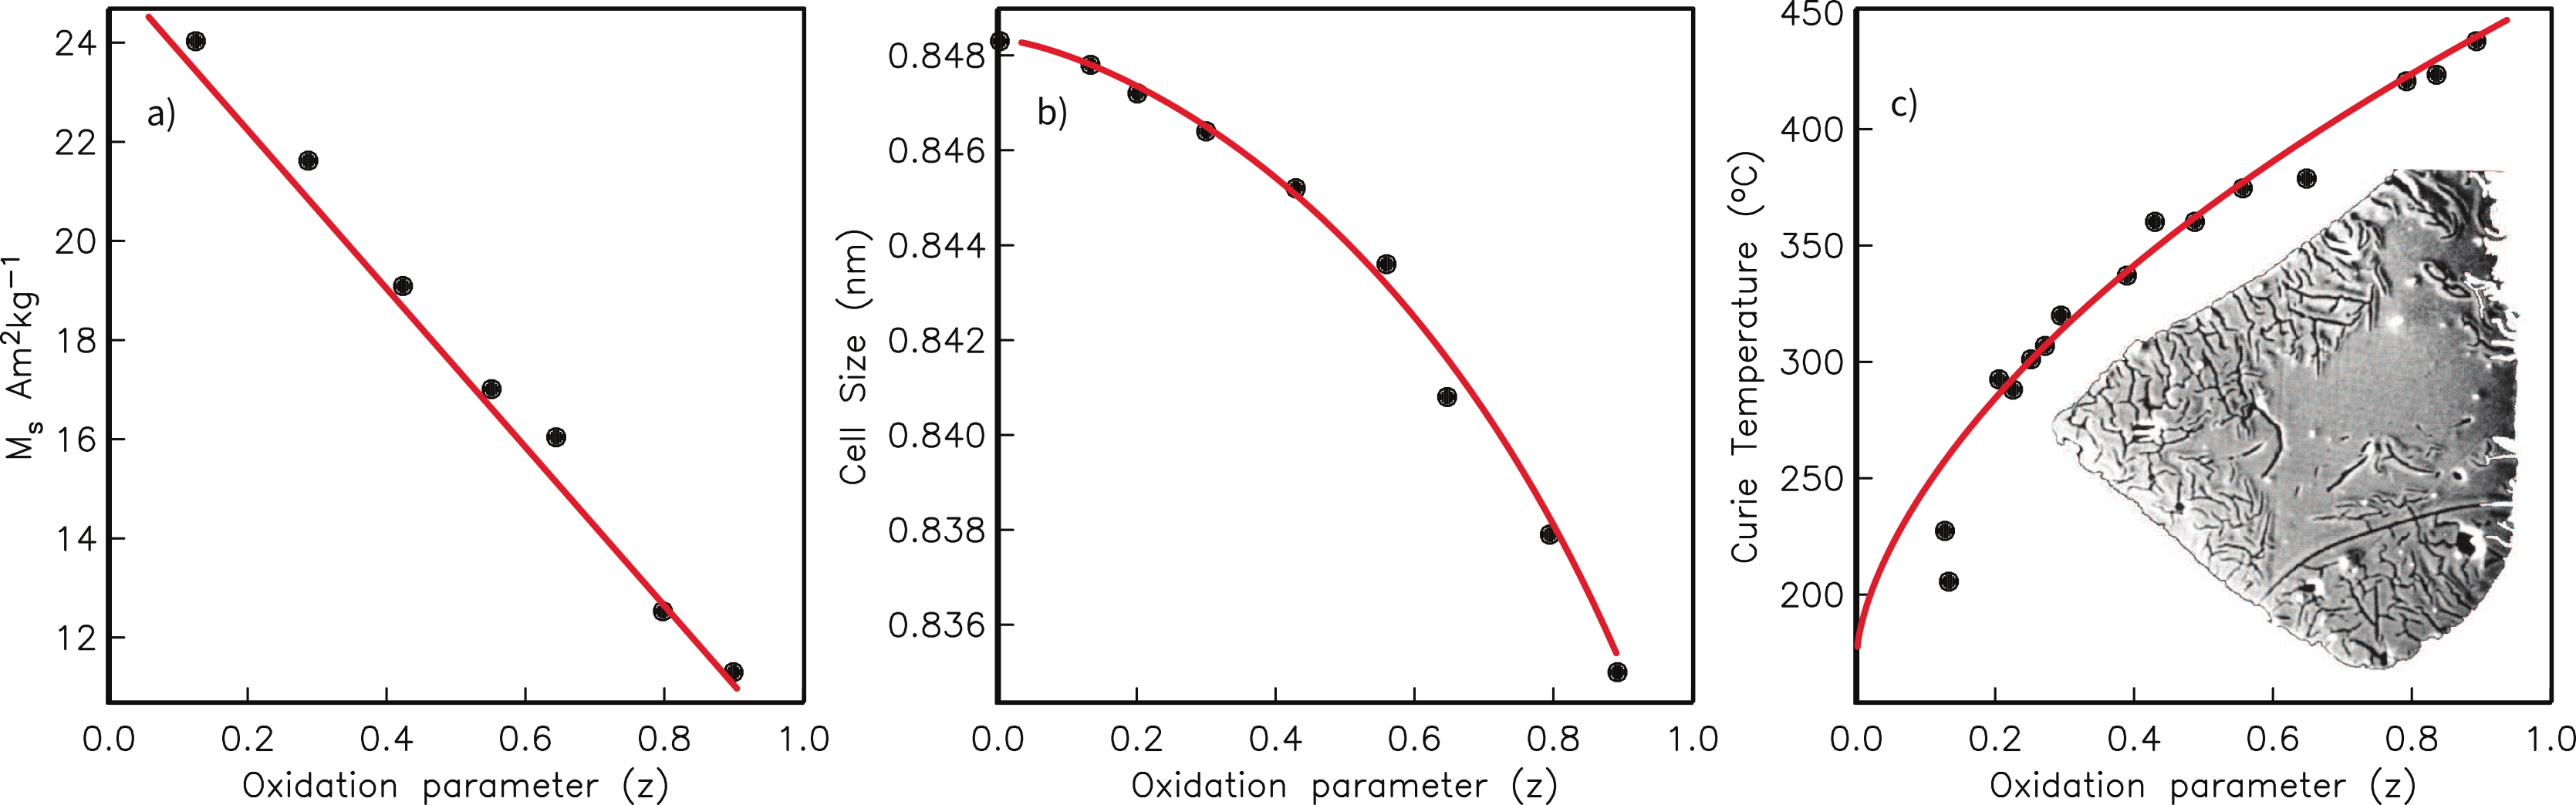
Figure 6.7:Variation of intrinsic parameters with oxidation in TM60. is the degree of oxidation. a) Variation of the magnetization. b) Variation of cell lattice size. c) Variation of Curie temperature. [Data compiled by Dunlop & Özdemir (1997).] Inset: A magnetite crystal (~30 μm) undergoing maghemitization. Because of the change in volume, the crystal begins to crack. [From Gapeyev & Tsel'movich (1988) in Dunlop & Özdemir (1997).]
Hematite occurs widely in oxidized sediments and dominates the magnetic properties of red beds. It occurs as a high temperature oxidation product in certain igneous rocks. Depending on grain size, among other things, it is either black (specularite) or red (pigmentary). Diagnostic properties of hematite are listed in Table 6.1.
The substitution of Ti into the lattice structure of FeO has an even more profound influence on magnetic properties than for magnetite. For the magnetization is spin-canted antiferromagnetic, but when , the magnetization becomes ferrimagnetic (see Figure 6.6a). For small amounts of substitution, the Ti and Fe cations are distributed equally among the cation layers. For , however, the Ti cations preferentially occupy alternate cation layers. Remembering that the Ti ions have no net moment, we can imagine that antiparallel coupling between the two sub-lattices results in ferrimagnetic behavior, as opposed to the equal and opposite style of anti-ferromagnetism.
Titanohematite particles with intermediate values of have interesting properties from a paleomagnetic point of view. There is a solid solution at high temperatures, but as the temperatures drop the crystals exsolve into titanium rich and poor lamellae (see Figure 6.2d). Figure 6.6 shows the variation in saturation magnetization and Néel temperature with Ti substitution. For certain initial liquid compositions, the exsolution lamellae could have Ti-rich bands alternating with Ti-poor bands. If the Ti-rich bands have higher magnetizations, yet lower Curie temperatures than the Ti-poor bands, the Ti-poor bands will become magnetized first. When the Curie temperature of the Ti-rich bands is reached, they will become magnetized in the presence of the demagnetizing field of the Ti-poor bands, hence they will acquire a remanence that is antiparallel to the applied field. Because these bands have higher magnetizations, the net NRM will also be anti-parallel to the applied field and the rock will be self-reversed. This is fortunately very rare in nature.
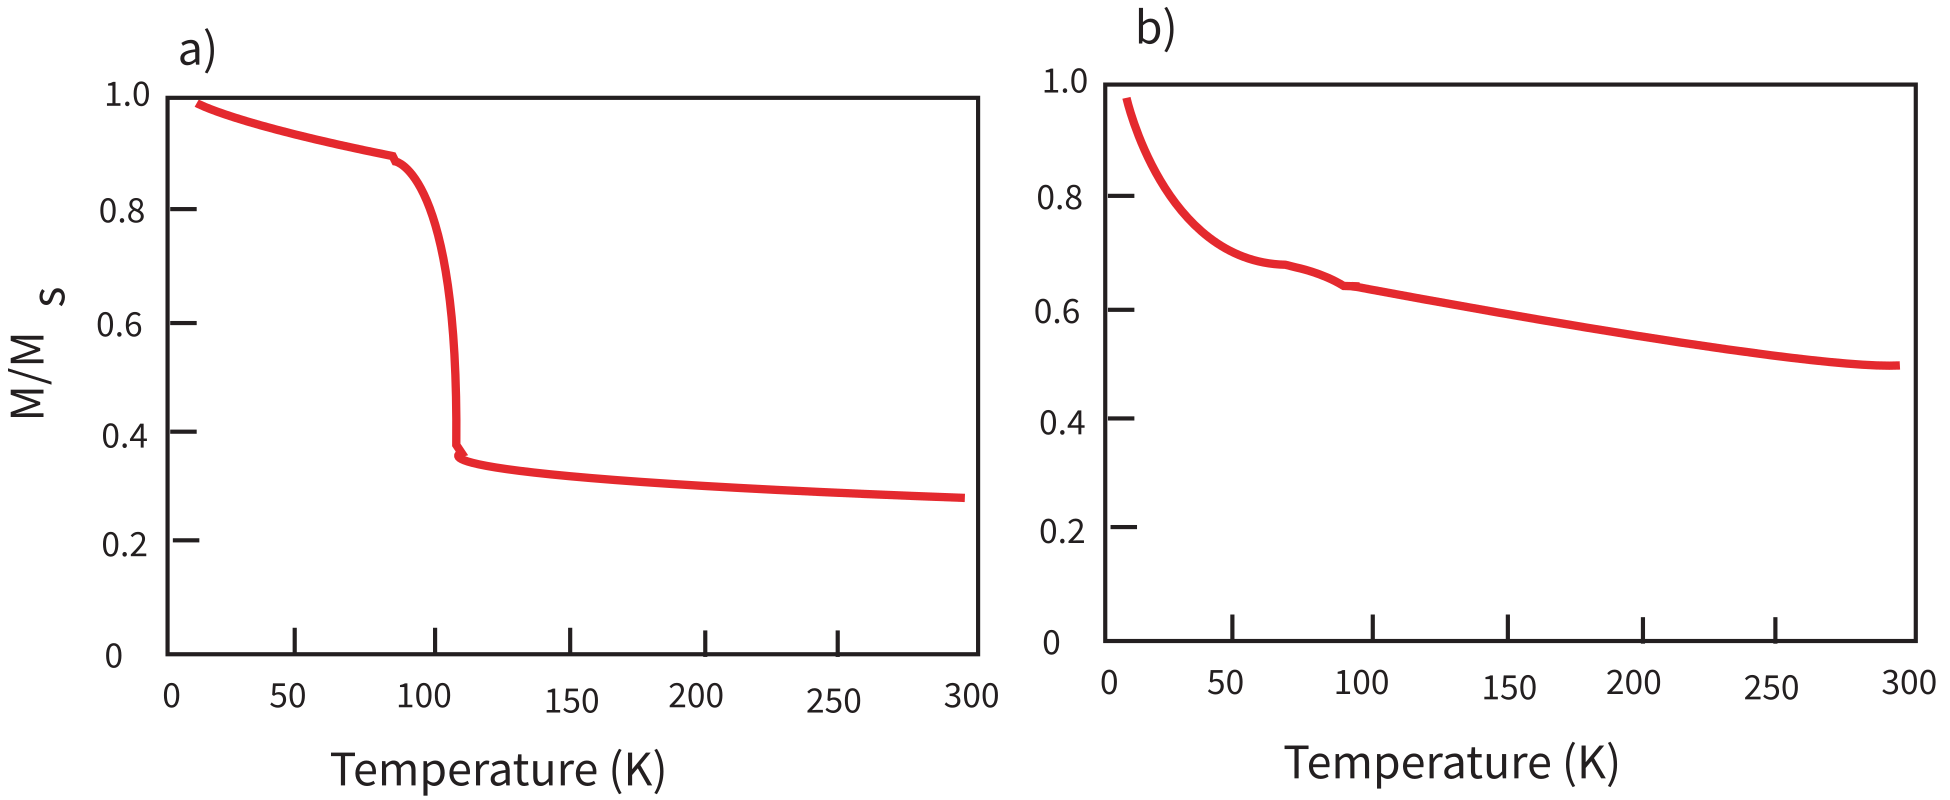
Figure 6.8:Effect of maghemitization on Verwey transition. a) Saturation remanence acquired at 10 K observed as it warms up for 37 nm stoichiometric magnetite. b) Same but for partially oxidized magnetite. [Data from Özdemir et al. (1993).]
6.1.3Oxidation of (titano)magnetites to (titano)maghemites
Many minerals form under one set of equilibrium conditions (say within a cooling lava flow) and are later subjected to a different set of conditions (sea-floor alteration or surface weathering). They will tend to alter in order to come into equilibrium with the new set of conditions. The new conditions are often more oxidizing than the original conditions and compositions tend to move along the dashed lines in Figure 6.3. The degree of oxidation is represented by the parameter .
While the solid solution between magnetite and ulvöspinel exists in principle, intergrowths of these two minerals are actually quite rare in nature because the titanomagnetites interact with oxygen in the melt to form intergrowths of low Ti magnetite with ilmenite. This form of oxidation is known as deuteric oxidation.
Low temperature oxidation will tend to transform a single phase spinel (titanomagnetite) into a new single phase spinel (titanomaghemite) by diffusion of Fe from the lattice structure of the (titano)magnetite to the surface where it is converted to Fe; titanomaghemite is a “cation-deficient” inverse spinel. The inset to Figure 6.7c shows a magnetite crystal in the process of becoming maghemite. The conversion of the Fe ion means a loss in volume which results in characteristic cracking of the surface. There is also a loss in magnetization, a shrinkage of cell size and, along with the tightening unit cell, an increase in Curie Temperature. These trends are shown for TM60 in Figure 6.7. Maghemitization results in a much reduced Verwey transition (see Figure 6.8).
The (titano)maghemite structure is metastable and can invert to form the isochemical, but more stable structure of (titano)hematite, or it can be reduced to form magnetite. The two forms of FeO are distinguished by the symbols for maghemite and for hematite. Inversion of natural maghemite is usually complete by about 350°C, but it can survive until much higher temperatures (for more details, see Dunlop & Özdemir (1997)). Also, it is common that the outer rim of the magnetite will be oxidized to maghemite, while the inner core remains magnetite.
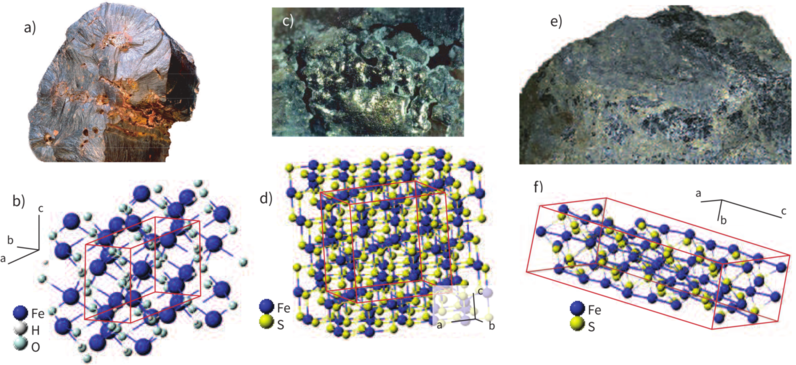
Figure 6.9:a) Photograph of goethite. [From en.wikipedia.org; photo of Eurico Zimbres.] b) Goethite crystal structure. c) Photograph of greigite. [Photo of William Péraud.] d) Greigite crystal structure. e) Photograph of single crystal of pyrrhotite. [Photo of Dan Weinrich.] f) Pyrrhotite crystal structure. [All crystal structure images from webmineral.com.]
6.2Iron-oxyhydroxides and iron-sulfides
Of the many iron oxyhydroxides that occur in any abundance in nature, goethite (FeOOH; Figure 6.9a,b) is the most common magnetic phase. It is antiferromagnetic with what is most likely a defect magnetization. It occurs widely as a weathering product of iron-bearing minerals and as a direct precipitate from iron-bearing solutions. It is metastable under many conditions and dehydrates to hematite with time or elevated temperature. Dehydration is usually complete by about 325°C. It is characterized by a very high coercivity but a low Néel temperature of about 120°C. Diagnostic properties of goethite are listed in Table 6.1.
There are two iron-sulfides that are important to paleomagnetism: greigite (FeS; Figure 6.9c,d) and pyrrhotite (FeS–FeS; Figure 6.9e,f). These are ferrimagnetic and occur in reducing environments. They both tend to oxidize to various iron oxides leaving paramagnetic pyrite as the sulfide component.
The Curie temperature of monoclinic pyrrhotite (FeS) is about 325°C (see Figure 6.10b; Table 6.1). Monoclinic pyrrhotite undergoes a transition at ~35 K, so low temperature measurements can be diagnostic for this phase (see Figure 6.10a). Hexagonal pyrrhotite undergoes a structural transition from an imperfect antiferromagnet to a ferromagnet with much higher saturation magnetization at about 200°C. During a thermomagnetic experiment, the expansion of the crystal results in a large peak in magnetization just below the Curie Temperature (see Figure 6.10c). Mixtures of monoclinic and hexagonal pyrrhotite result in the behavior sketched in Figure 6.10d. The maximum unblocking temperature of greigite is approximately 330°C. Other diagnostic properties of greigite and pyrrhotite are listed in Table 6.1.
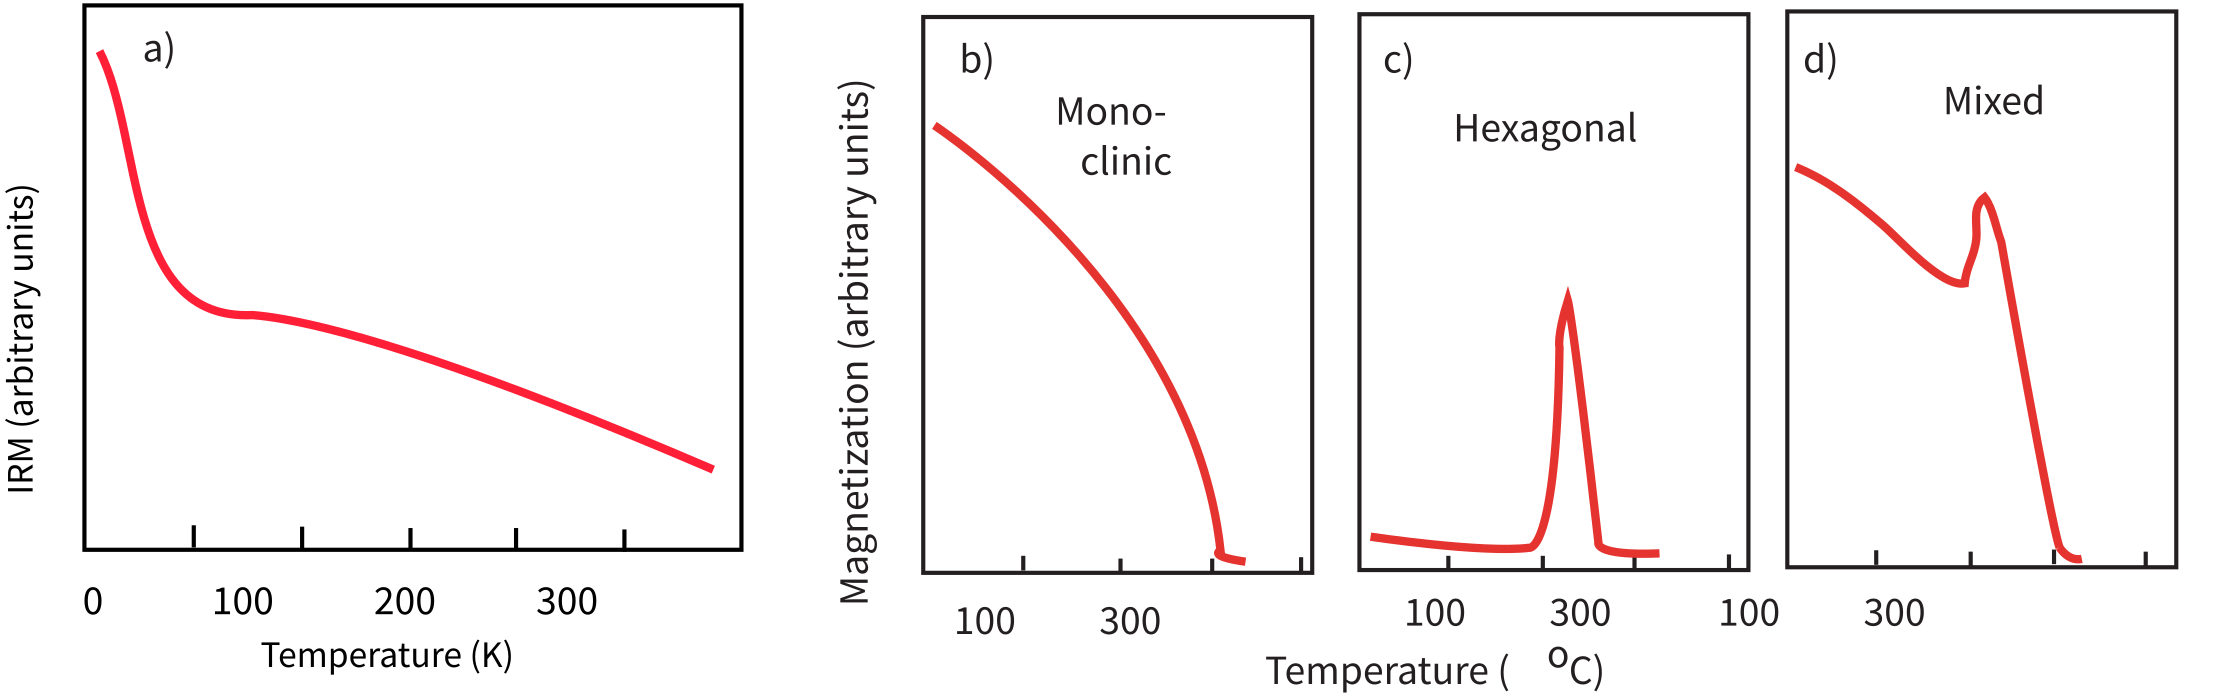
Figure 6.10:a) Low-temperature transition in monoclinic pyrrhotite. [Data from Snowball & Torii (1999).] Thermomagnetic curves for b) monoclinic c) hexagonal and d) mixture of b) and c) pyrrhotite. [Data from Dekkers (1988).]
6.3FeTi oxides in igneous rocks
The composition and relative proportions of FeTi oxides, crystallizing from a silicate melt depend on a number of factors, including the bulk chemistry of the melt, oxygen fugacity and the cooling rate. The final assemblage may be altered after cooling. FeTi oxides are generally more abundant in mafic volcanic rocks (e.g. basalts) than silicic lavas (e.g., rhyolites). FeTi oxides can be among the first liquidus phases (~1000°C) in silicic melts, but in mafic lavas they generally are among the last phases to form (~1050°C), often with plagioclase and pyroxene.
Although there is considerable variability, the Ti (ulvöspinel) content of the titanomagnetite crystallizing from a melt generally is lower in more silicic melts (see solid black lines in Figure 6.11). Titanomagnetites in tholeiitic lavas generally have 0.5 < < 0.8 with an initial composition near TM60 (=0.6) characteristic for much of the oceanic crust. The range of rhombohedral phases (dashed red lines) crystallizing from silicate melts is more limited, 0.05 < < 0.3 for most lavas.
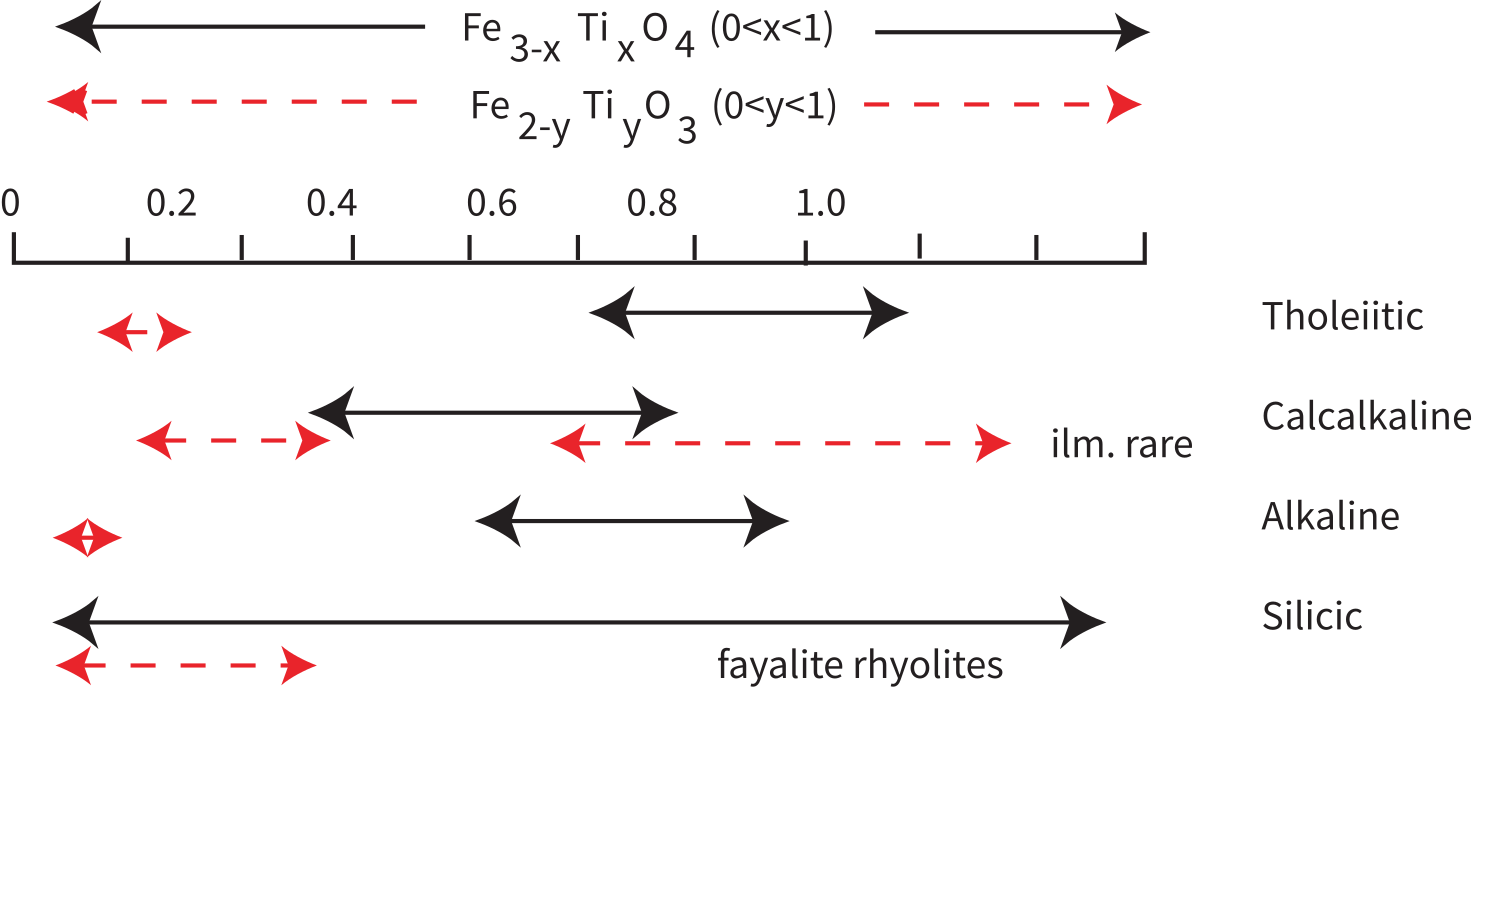
Figure 6.11:Occurrence of FeTi oxides in igneous rocks. [Data from Frost & Lindsley (1991).]
The final magnetic mineral assemblage in a rock is often strongly influenced by the cooling rate and oxygen fugacity during initial crystallization. As a first approximation, we distinguish slowly cooled rocks (which may undergo solid state exsolution and/or deuteric oxidation) from those in which the oxide minerals were rapidly quenched. As mentioned before, FeTi oxides in slowly cooled igneous rocks can exhibit exsolution lamellae with bands of low and high titanium magnetites if the oxygen fugacity remains unoxidizing. This reaction is very slow, so its effects are rarely seen in nature.
The typical case in slowly cooled rocks is that the system becomes more oxidizing with increasing differentiation during cooling and crystallization. For example, both the dissociation of magmatic water and the crystallization of silicate phases rich in Fe will act to increase the oxidation state. This will drive compositions to higher values (see Figure 6.3). The final assemblage typically consists of ilmenite lamellae and a nearly pure magnetite host because adding O drives the reaction FeTiO + O FeO to the right. This process is known as oxyexsolution. Under even more oxidizing conditions, these phases may ultimately be replaced by their more oxidized counterparts (e.g., hematite, pseudobrookite).
Weathering at ambient surface conditions or mild hydrothermal alteration may lead to the development of cation deficient (titano)maghemites. This can either occur by addition of oxygen to the spinel phase with a corresponding oxidation of the Fe to Fe to maintain charge balance, or by the removal of some of the octahedral iron from the crystal structure.
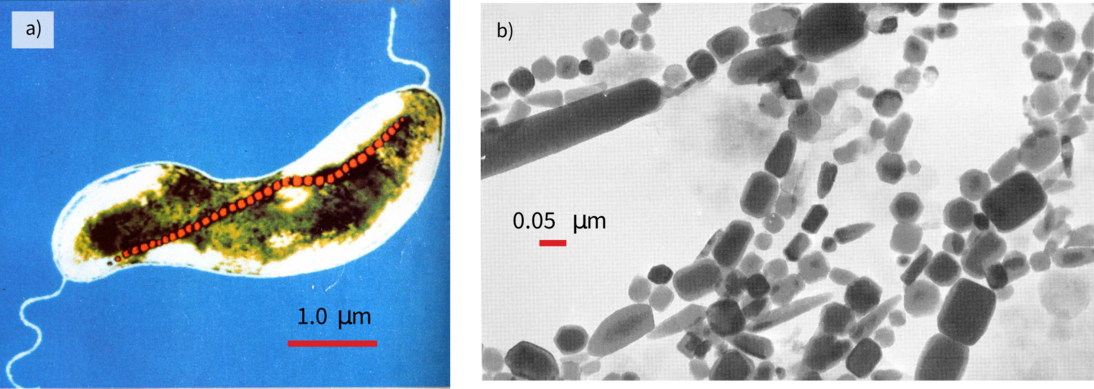
Figure 6.12:Photomicrographs of bacterial magnetites produced by magnetotactic bacteria. a) Intact magnetosome in living bacterium. [False color image from H. Vali in Maher & Thompson (1999).] b) Chains recovered from ODP Site 1006D in the Bahamas. [From M. Hounslow in Maher & Thompson (1999).]
6.4Magnetic mineralogy of soils and sediments
Igneous (and metamorphic) rocks are the ultimate source for the components of sedimentary rocks, but biological and low-temperature diagenetic agents work to modify these components and have a significant effect on magnetic mineralogy in sediments. As a result there is a virtual rainbow of magnetic mineralogies found in sediments. (Titano)magnetite coming into the sedimentary environment from an igneous source may experience a change in pH and redox conditions that make it no longer the stable phase, hence it may alter. Also, although the geochemistry of seawater is generally oxidizing with respect to the stability field of magnetite, pronounced changes in the redox state of sediments often occur with increasing depth as a function of the breakdown of organic carbon. Such changes may result in locally strongly reducing environments where magnetite may be dissolved and authigenic sulfides produced. Indeed, changes down sediment cores in the ferrimagnetic mineral content and porewater geochemistry suggest that this process is active in some (most?) marine sedimentary sequences. For example, dissolution of magnetite and/or production of non-magnetic sulfides may be responsible for the oft-seen decrease in various bulk magnetic parameters (e.g., magnetic susceptibility, IRM, ARM, etc.) with depth.
Some of the more spectacular magnetic minerals found in sediments are biogenic magnetites produced by magnetotactic bacteria (see review by Kopp & Kirschvink (2008) and Figure 6.12). The sizes and shapes of bacterial magnetite, when plotted on the Evans diagram from Chapter 4, suggest that magnetotactic bacteria form magnetite in the single domain grain size range—otherwise extremely rare in nature. It appears that bacterial magnetites are common in sediments, but their role in contributing to the natural remanence is still poorly understood.
6.5Physical properties of magnetic minerals
Table 6.1:Physical properties of magnetic minerals
Property | Value | Reference |
|---|---|---|
Magnetite: FeO | ||
Density | 5197 kg m | |
Curie temperature | 580°C | |
Saturation Magnetization | 92 Amkg | |
Anisotropy Constant | -2.6 Jkg | |
Volume susceptibility | ~1 SI | |
Typical coercivities | 10’s of mT | |
Verwey transition | 110-120 K | |
Cell edge | 0.8396 nm | |
Maghemite: FeO | ||
Density | 5074 kg m | |
Curie temperature | 590-675°C | |
Saturation Magnetization | 74 Amkg | |
Anisotropy Constant | 0.92 Jkg | |
Verwey transition | suppressed | |
Breaks down to FeO | 250→750°C | |
TM60: FeTiO | ||
Density | 4939 kg m | |
Curie temperature | 150°C | |
Saturation Magnetization | 24 Amkg | |
Anisotropy Constant | 0.41 Jkg | |
Coercivity | ~8 mT | |
Verwey transition | suppressed | |
Cell edge | 0.8482 nm | |
Hematite: FeO | ||
Density | 5271 kg m | |
Néel temperature | 680–690°C | |
Saturation Magnetization | 0.4 Amkg | |
Anisotropy Constant | 228 Jkg | |
Volume susceptibility | ~1.3 × 10 SI | |
Coercivities | can be 10’s of teslas | |
Morin Transition | ~250-260 K (for > 0.2 μm) | |
Goethite: FeOOH | ||
Density | 4264 kg m | |
Néel temperature | ~120°C | |
Saturation Magnetization | 10→1 Amkg | |
Anisotropy Constant | 0.25→2 Jkg | |
Volume susceptibility | ~1 × 10 SI | |
Coercivities | can be 10’s of teslas | |
Breaks down to hematite | 250→400°C | |
Pyrrhotite: FeS | ||
Density | 4662 kg m | |
Monoclinic Curie temperature | ~325°C | |
Hexagonal Curie temperature | ~270°C | |
Saturation Magnetization | 0.4–~20 Amkg | |
Volume susceptibility | ~1 × 10→1 SI | Collinson (1983); O'Reilly (1984) |
Anisotropy Constant | 20 Jkg | |
Coercivities | can be 100’s of mT | |
Low-T transition | ~34 K | |
Hexagonal pyrrhotite transition | near 200°C | |
Breaks down to magnetite | ~500°C | |
Greigite: FeS | ||
Density | 4079 kg m | |
Maximum unblocking temperature | ~330°C | |
Saturation Magnetization | ~25 Amkg | |
Anisotropy Constant | -0.25 Jkg | |
Coercivity | 60→>100 mT | |
ratios | ~70 × 10 Am | |
Breaks down to magnetite | ~270-350°C |
Supplemental Readings: Dunlop & Özdemir (1997), Chapter 3; Kopp & Kirschvink (2008).
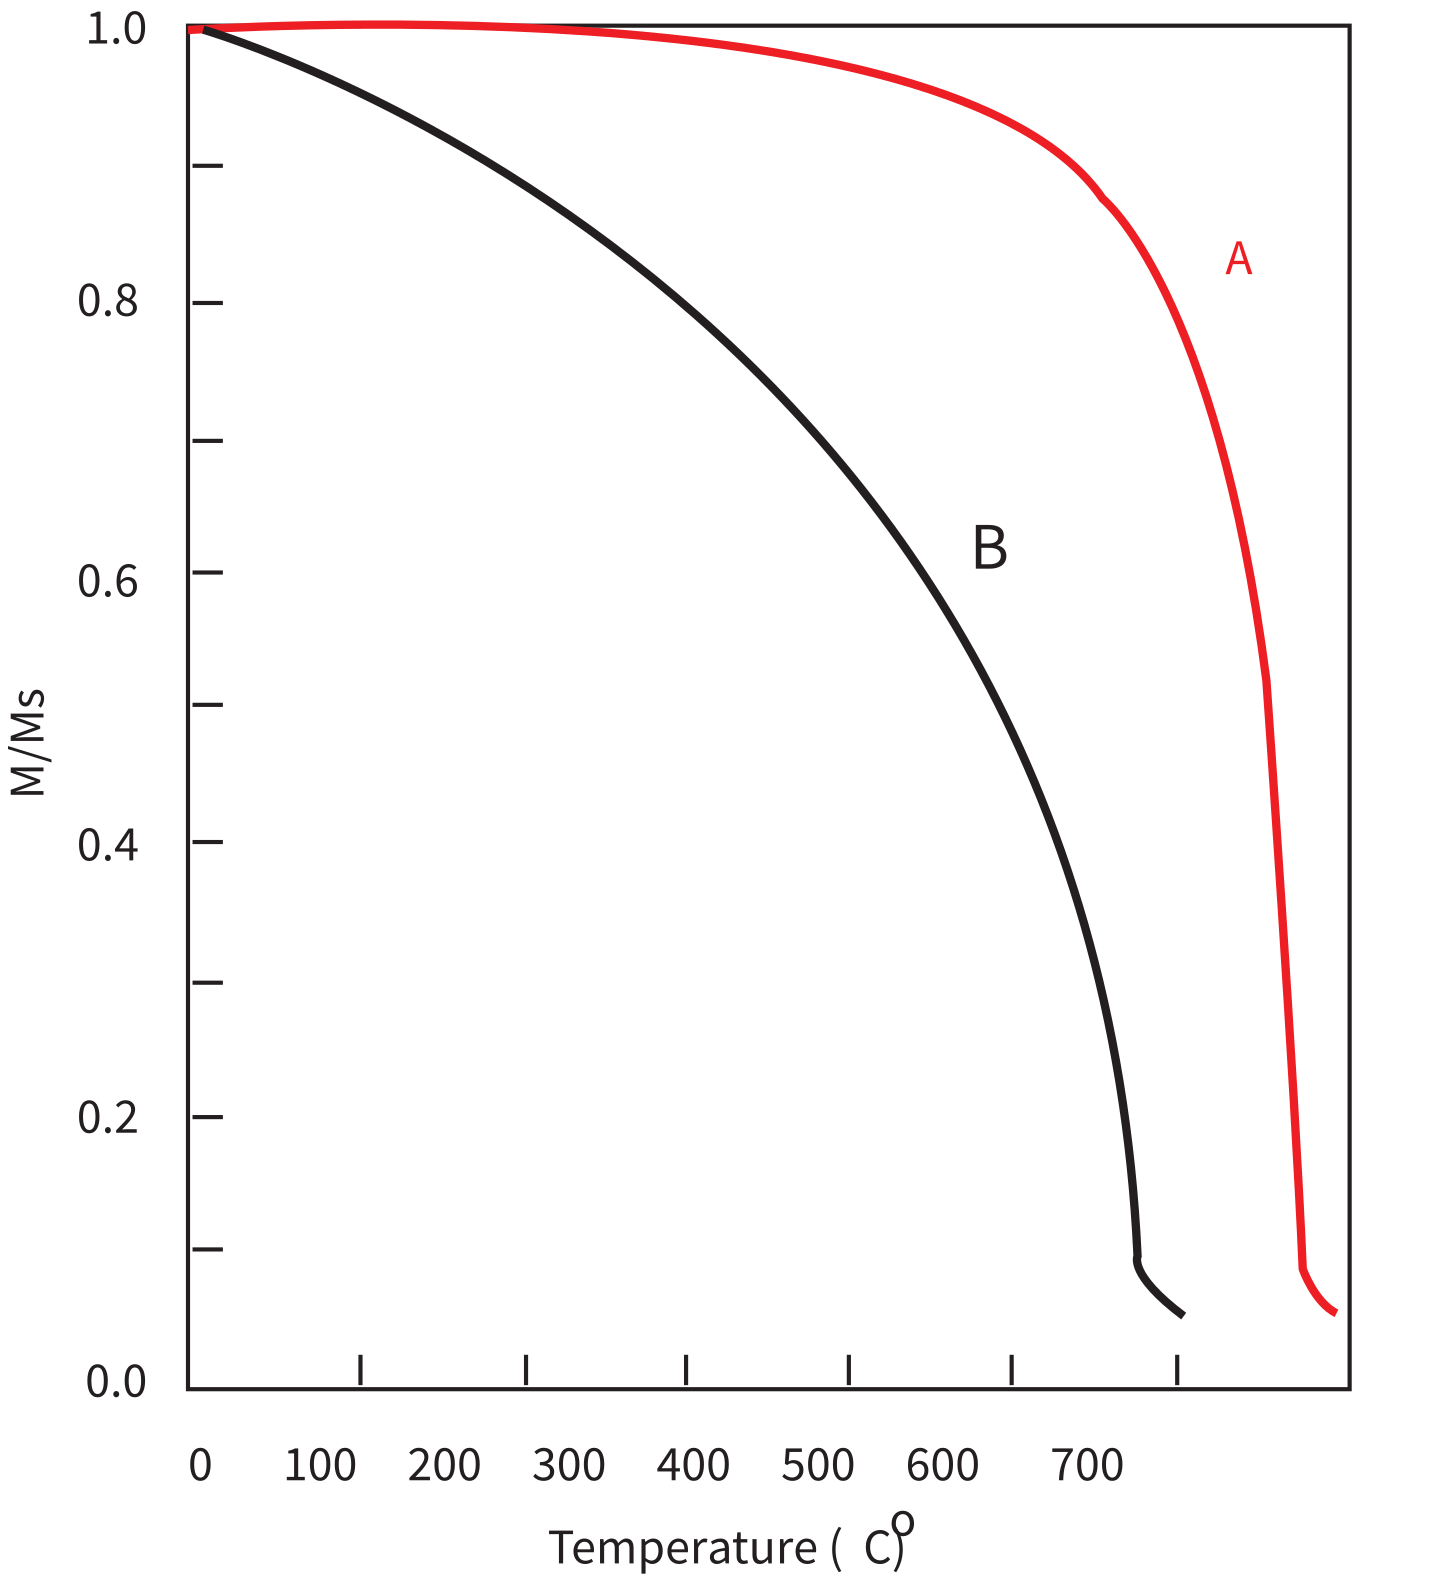
Figure 6.13:Curie Temperature curves for two samples, A and B. [Figure redrawn from Butler (1992).]
6.6Problems
Problem 1
You measured Curie Temperature curves for two samples A and B as shown in Figure 6.13. Based on your knowledge of Curie Temperatures, what is the likely magnetic mineralogy for each sample?
Problem 2
The data in demag.dat in the Chapter_6 data directory are thermal demagnetization data for a specimen that had a 2 T field exposed along , a 0.4 T field exposed along and a 0.12 T field exposed along . The sample was then heated to a particular temperature step (°C) and cooled in zero magnetic field, allowing all grains that become superparamagnetic at temperatures lower than the treatment temperature to become randomized. After each treatment step, the magnetic vector was measured. The column headings are: Treatment temperature (C), Intensity, Declination, Inclination.
a) Write a python program to read the data in and convert the declination, inclination and intensity to cartesian components.
b) Modify your program to normalize the intensities to that measured at 20°C.
c) Extend the program to plot the and components as a function of temperature.
d) Based on your understanding of coercivity and Curie temperatures, what is carrying the and components?
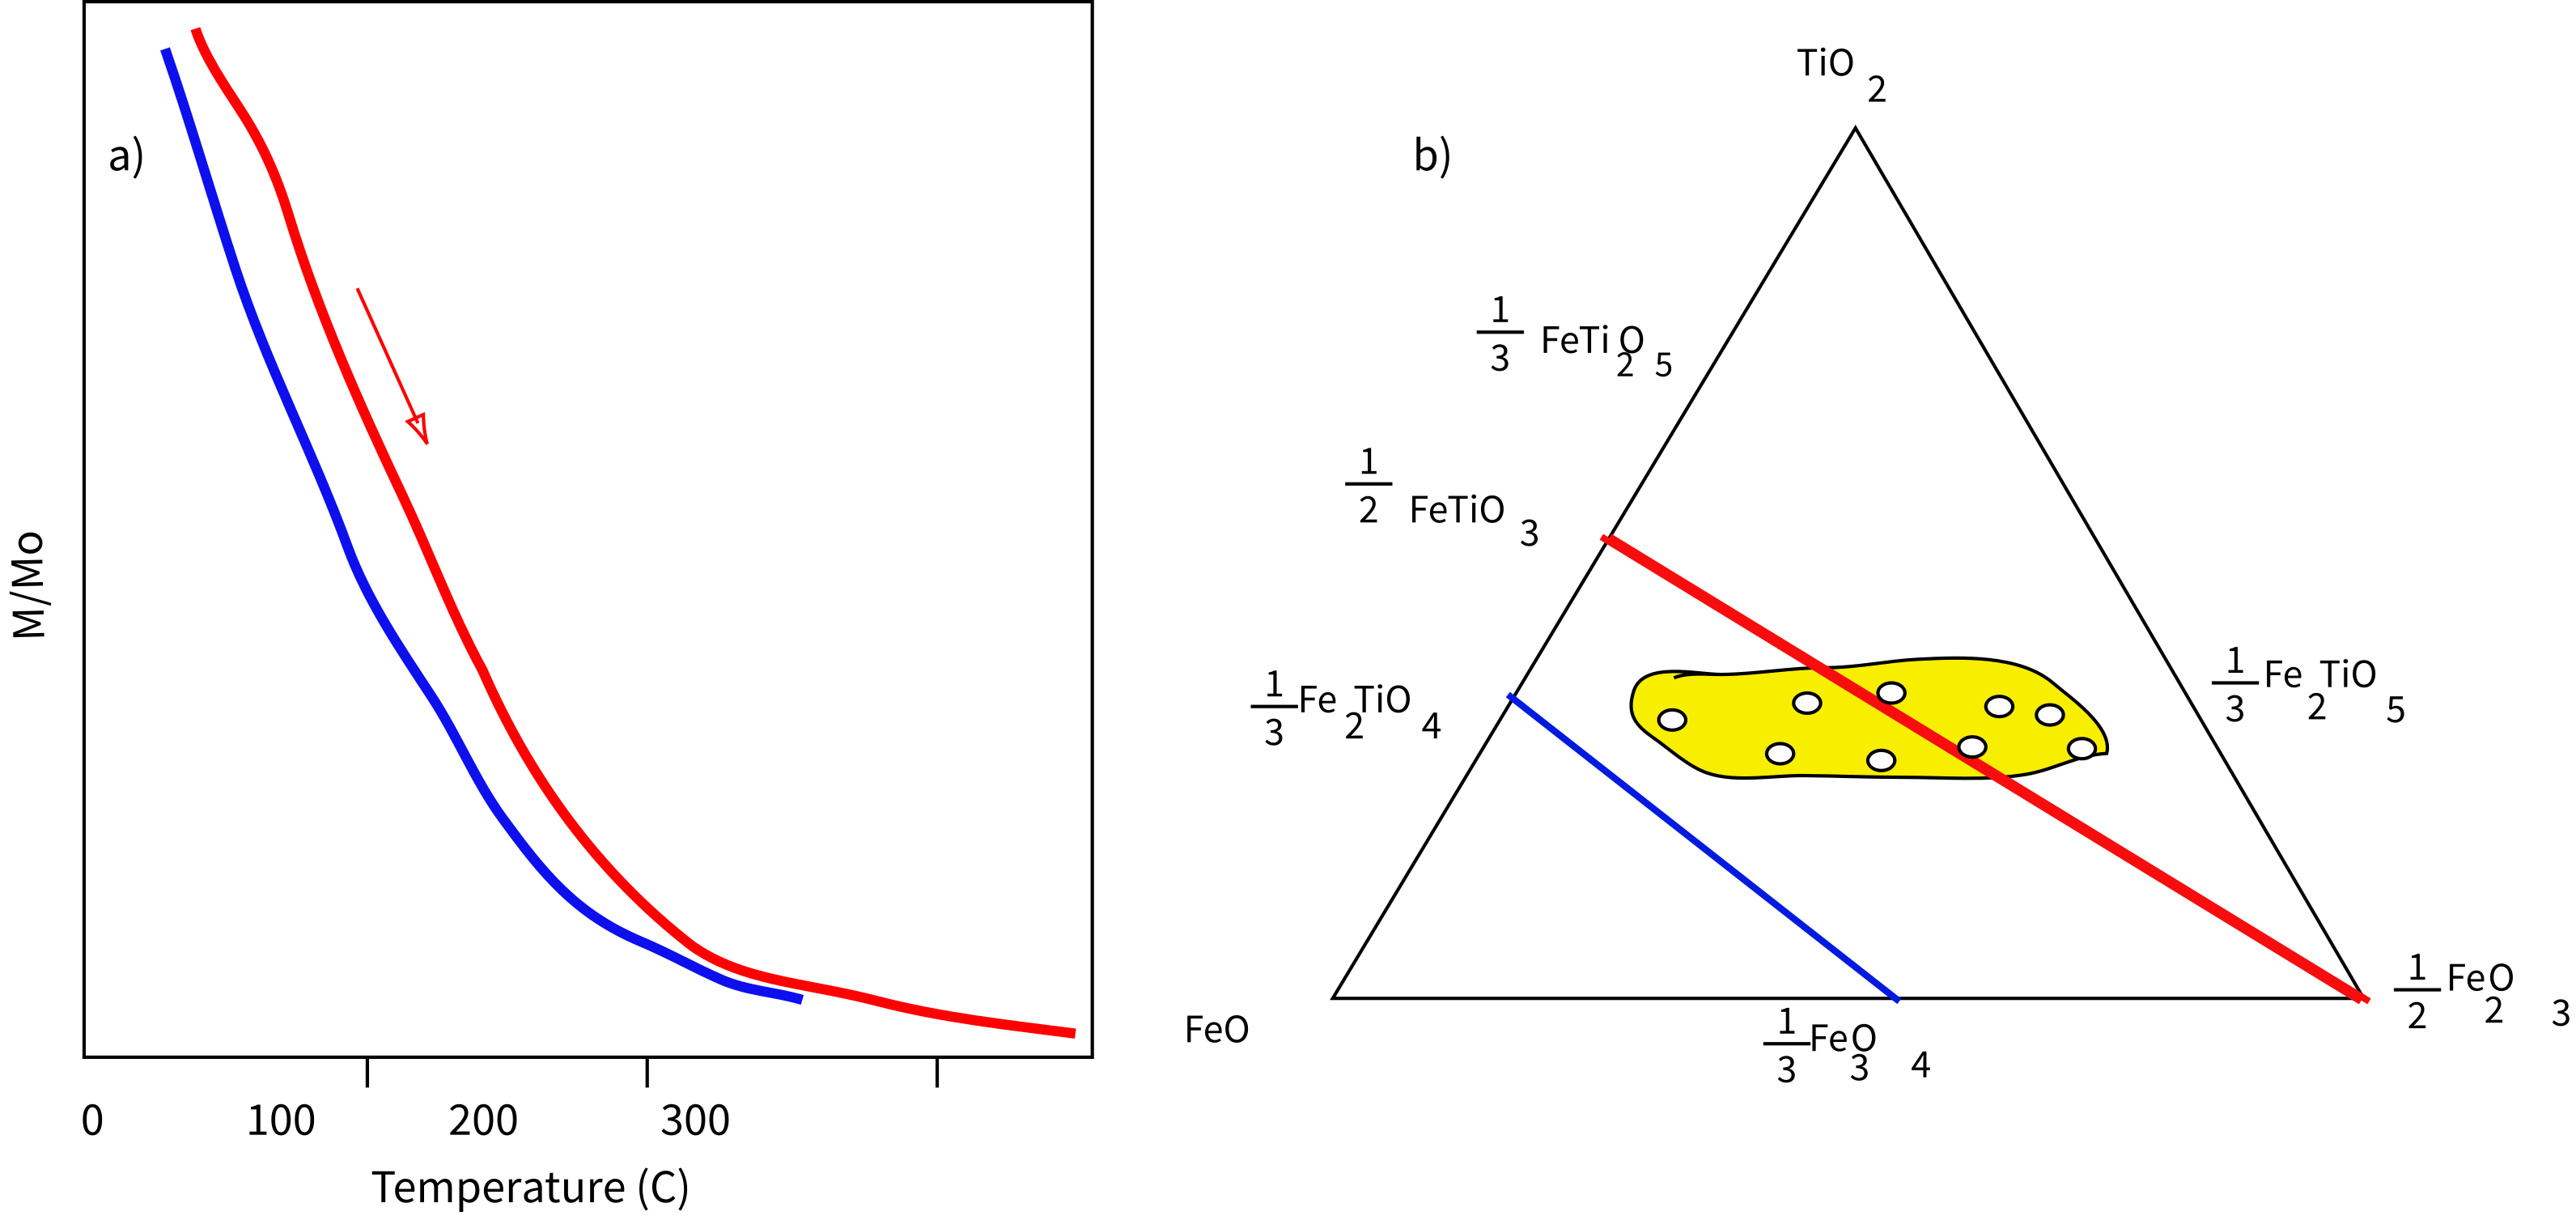
Figure 6.14:a) Thermomagnetic run of mineral whereby magnetization (normalized by the initial value) is measured as a function of temperature. The red line is the heating curve and the blue line is the cooling curve. b) Electron microprobe data from FeTi oxides (dots in yellow field) plotted on TiO-FeO-FeO ternary diagram. [Figure redrawn from Butler (1992).]
Problem 3
Ferromagnetic minerals in two rock samples are known to be FeTi oxides and are found to have the properties described below. Using this information and looking up the properties of FeTi oxides described in the text, identify the ferromagnetic minerals. For titanomagnetite or titanohematite, approximate the compositional parameter ( or ).
a) Strong-field thermomagnetic analysis indicates a dominant Curie temperature = 420°C. Subjecting the specimen to increasingly larger fields to measure successive isothermal remanences (see Chapter 5) reveals a coercivity spectrum with a coercivity of less than 300 mT. What is this ferromagnetic mineral?
b) Strong-field thermomagnetic analysis (used for measuring the Curie temperature) shows the behavior in Figure 6.14a with Curie temperature = 200°C. In addition, electron microprobe data indicates abundances of FeO, FeO, and TiO shown in Figure 6.14b. Unfortunately, electron microprobe data are not very effective in determining the FeO:FeO ratio (placement from left to right in the TiO-FeO-FeO ternary diagram). Accordingly, there is much uncertainty in the FeO:FeO ratio indicated by the microprobe data. But microprobe data are effective in determining the TiO:(FeO + FeO) ratio (placement from bottom to top in the TiO-FeO-FeO ternary diagram). With this information, identify the ferromagnetic mineral.
- Roberts, A. P. (2025). Mineral Magnetism. Cambridge University Press. 10.1017/9781108935630
- Nagata, T. (1961). Rock Magnetism (2nd ed.). Maruzen.
- Robinson, P., Harrison, R. J., McEnroe, S. A., & Hargraves, R. B. (2004). Nature and origin of lamellar magnetism in the hematite-ilmenite series. American Mineralogist, 89(5–6), 725–747. 10.2138/am-2004-5-607
- Feinberg, J. M., Scott, G. R., Renne, P. R., & Wenk, H.-R. (2005). Exsolved magnetite inclusions in silicates: Features determining their remanence behavior. Geology, 33(6), 513–516. 10.1130/G21290.1
- Robinson, P., Harrison, R. J., McEnroe, S. A., & Hargraves, R. B. (2002). Lamellar magnetism in the haematite-ilmenite series as an explanation for strong remanent magnetization. Nature, 418, 517–520. 10.1038/nature00942
- Butler, R. F. (1992). Paleomagnetism: Magnetic Domains to Geologic Terranes. Blackwell Scientific Publications.
- O’Reilly, W. (1984). Rock and Mineral Magnetism. Blackie. 10.1007/978-1-4684-8468-7
- Dunlop, D. J., & Özdemir, Ö. (1997). Rock Magnetism: Fundamentals and Frontiers. Cambridge University Press. 10.1017/CBO9780511612794
- Stacey, F. D., & Banerjee, S. K. (1974). The Physical Principles of Rock Magnetism. Elsevier.
- Curie, P. (1895). Propriétés magnétiques des corps à diverses températures. Annales de Chimie et de Physique, 5, 289–405.
- Néel, L. (1936). Théorie du paramagnétisme constant; application au manganèse. Comptes Rendus de l’Académie Des Sciences, 203, 304–306.
- Gapeyev, A. K., & Tsel’movich, V. A. (1988). Stages of oxidation of titanomagnetite grains in igneous rocks. Viniti N. Moscow, 1331-B89, 3–8.
- Özdemir, Ö., Dunlop, D. J., & Moskowitz, B. M. (1993). The effect of oxidation on the Verwey transition in magnetite. Geophysical Research Letters, 20(16), 1671–1674. 10.1029/93GL01483
- Snowball, I., & Torii, M. (1999). Incidence and significance of magnetic iron sulphides in Quaternary sediments and soils. In B. A. Maher & R. Thompson (Eds.), Quaternary Climates, Environments and Magnetism (pp. 199–230). Cambridge University Press. 10.1017/CBO9780511535635.007
- Dekkers, M. J. (1988). Magnetic properties of natural pyrrhotite. Part I: Behaviour of initial susceptibility and saturation-magnetization-related rock-magnetic parameters in a grain-size dependent framework. Physics of the Earth and Planetary Interiors, 52, 376–393. 10.1016/0031-9201(88)90129-X