Superparamagnetism
Superparamagnetism (SP) describes the state of a single-domain-sized grain when thermal energy is sufficient to overcome barriers to a reversal of magnetization. Here the term “reversal” assumes uniaxial anisotropy with two minimum energy states having anti-parallel moment orientations. Energy barriers to magnetization changing arise from magnetocrystalline, magnetoelastic and/or shape anisotropy, all of which are proportional to grain volume (V). When the energy barriers are large with respect to thermal energy, the magnetization is “blocked” and the probability of spontaneous reversal approaches nil. But when the barriers are relatively low, thermal excitations can result in reversal of the magnetization over very short time scales, and the grain is in a superparamagnetic state. At a given temperature the volume at which a particle goes from being unblocked to blocked is known as the blocking volume (Vb). For a given volume, we can block the grain by lowering the temperature (i.e. decreasing the available thermal energy) below the blocking temperature (Tb).

Figure 1:Ferrofluid (containing SP iron particles) placed over a rare earth magnet. Source: Wikimedia Commons.
More formally, we can think about SP blocking in terms of a particle’s characteristic relaxation time () and how rapidly a particle or assemblage of particles may approach equilibrium. Based on Néel theory of thermally activated magnetization (Néel, 1949) and the terminology of Dunlop and Özdemir (1997), the equilibrium magnetization () for aligned, uniaxial grains is given by:
which is for small where,
and the relaxation time () in weak or zero field is:
where is the saturation magnetization, is the permeability of free space, is a (weak) applied field, and is a time constant related to the atomic reorganization time (on the order of 10-9 s), is Boltzmann’s constant, and is an anisotropy constant also related to particle microcoercivity. In the equilibrium state, some fraction of the population has the high‐energy moment orientation (antiparallel to the applied field) while others occupy the low‐energy orientation, and spontaneous reversals occur at the same rate in each orientation (like a two‐way reaction in chemical equilibrium). For an assemblage of randomly oriented single‐domain grains, the relationship follows a Langevin function as:
for small .
When is short compared to the observation time (the superparamagnetic state), the sample moment can equilibrate quickly with changes in applied field. In contrast, when is long the sample is blocked and in a stable single domain (SSD) state; it can take a very long time (millions or billions of years) to reach magnetic equilibrium. Whether or not a particle is SP or SSD will depend on both temperature and volume, through their effect on .
Remanence Data
The typical remanence experiments performed by researchers at the IRM include low-temperature cycling (300K → 20K → 300K) of a room-temperature (300K) saturation isothermal remanence (SIRM). A second common experiment cools the sample in zero field (ZFC) to low (e.g. 10K) temperature, where an SIRM is imparted. This low-temperature remanence is then measured as the sample warms back to room temperature. A room-temperature SIRM is not typically useful for studying SP particles, because they will not block at room temperature. However, many grains that are SP at room temperature will be SSD (blocked) at 20K. A sample with a low-temperature SIRM that warms in zero field () will demagnetize via the unblocking of these particles as they pass through their blocking temperature. If the sample contains a relatively narrow grain-size distribution of SP particles, the low-temperature remanence will unblock over a relatively narrow temperature interval (e.g. Figure 2, circles). If, however, the sample has a more distributed grain-size distribution, the unblocking will be more gradual (e.g. Figure 2, squares and diamonds). See Worm and Jackson (1999) for a discussion of volume distribution calculations based on the unblocking of a low-temperature remanence.
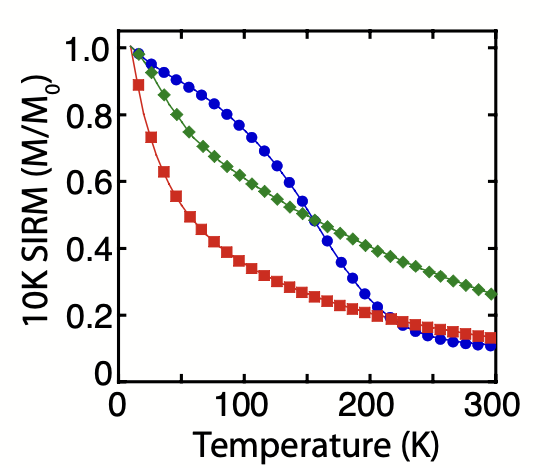
Figure 2:Saturation IRM acquired at 10K (ZFC) and measured on warming from 10K to 300K. The decrease in magnetization results from thermal unblocking of an SP population. Blue circles are from a Tiva Canyon Tuff sample with a relatively narrow grain-size distribution. Data from the same sample are shown in Figure 3 and Figure 4b. Red squares and green triangles are from synthetic, glassy basalts with more distributed grain-size distributions.
However, not every such gradual decrease of low-temperature temperature remanence on warming is related to superparamagnetism. Moskowitz et al. (1998) demonstrate that multi-domain, high-Ti titanomagnetite exhibits similar behavior resulting from domain reorganization as magnetocrystalline anisotropy decreases on warming.
Induced Magnetization Data
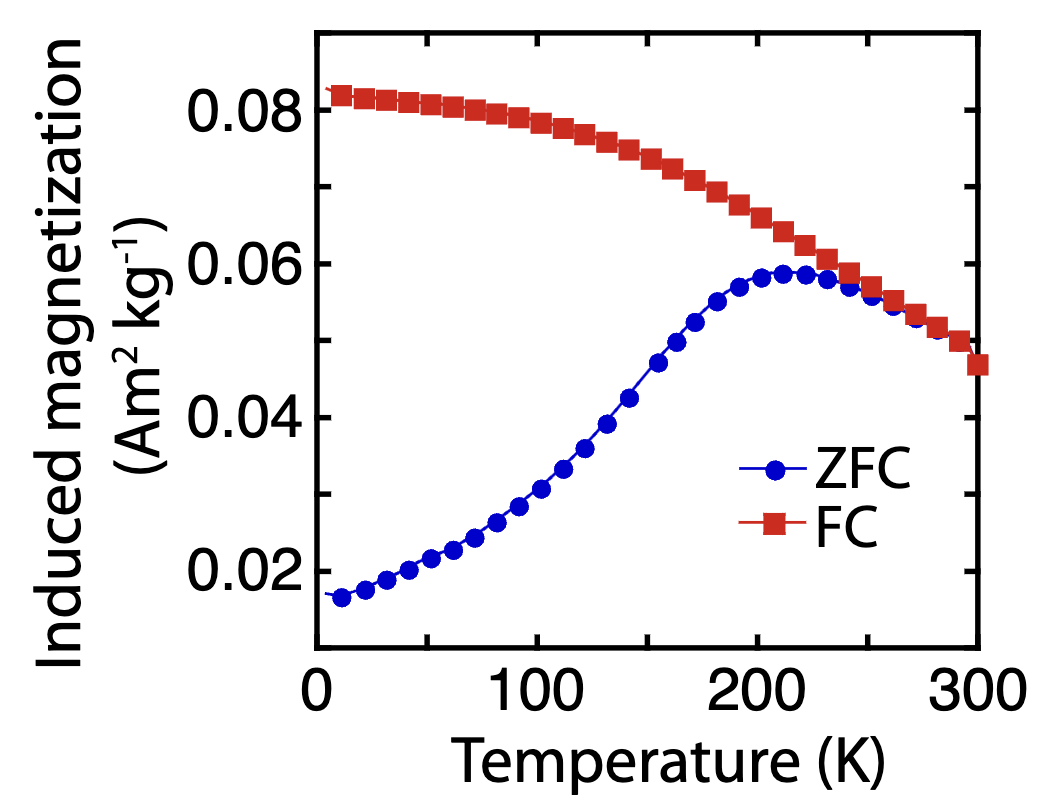
Figure 3:Induced FC-ZFC experiment on Tiva Canyon Tuff sample. Sample is cooled in zero field and then measured on warming in a 5 mT DC field (blue circles). Sample is then cooled in a 5 mT field and measured on warming in a 5 mT field. Sample is fully unblocked when the two curves coincide. Data from the same sample are shown in Figure 2 (circles) and Figure 4b.
In an experiment more common to the physics community (but also used by rock magnetists, e.g. Berquó et al., 2007), a sample is cooled in zero field (ZFC) to a low temperature such as 20K, and the induced sample moment () is then measured on warming in the presence of a small (e.g. 5 mT) field. This is followed by cooling the sample in the same 5 mT field (FC) and again measuring on warming in a 5 mT field (Figure 3). In the FC case, for (T < T_b), magnetization can be described by regular TRM theory, i.e.
for a uniform distribution of particles with a single . For non-uniform distributions (e.g. Figure 3), Eq. (4) must be integrated over all . In the ZFC case, as the sample warms back up, is initially less than because the sample has blocked in a zero-field remanence. As the sample warms through , becomes short enough that the moment approaches in the applied field. The point where the FC and ZFC curves join together defines the (maximum) blocking temperature, and for , both curves represent . If the sample has a narrow-enough grain-size distribution and enough is known about its properties in order to estimate , particle volume can be estimated by solving Eq. (3) for .
AC Susceptibility Data
In measuring low-field susceptibility (), a weak, time-varying alternating field [] is applied to the sample, and the magnetic response is measured. Consider the behavior of a superparamagnetic grain above and below its blocking temperature. At , the grain is ferromagnetically ordered, but is very short compared to the observation time (), and the moment will respond exactly in phase with the alternating field.
For an assemblage of randomly-oriented identical grains, susceptibility falls off with 1/T according to:
This type of behavior can be observed in Figure 4a at .
At , is very long compared to , the grains are fully blocked in the SSD state, and susceptibility will be negligible in weak fields:
where is the microcoercivity of the grain (the field required to reverse the magnetization in the absence of any thermal effects). This type of behavior is observed in Figure 4c at .
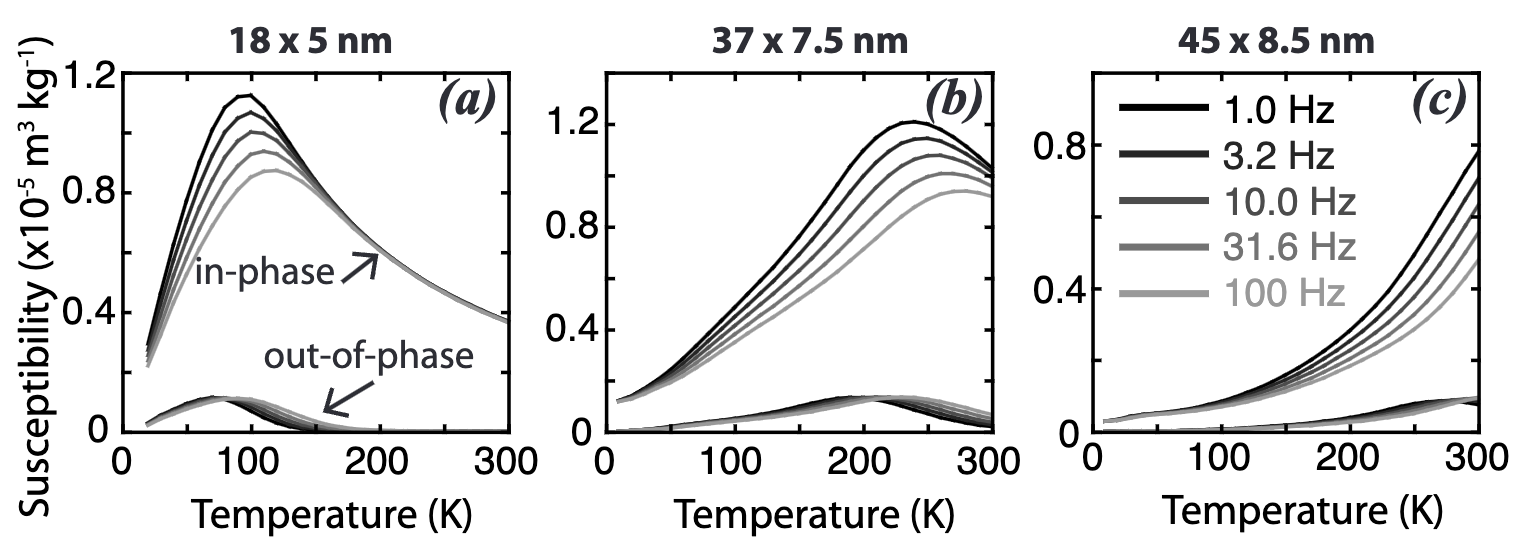
Figure 4:AC susceptibility measured as a function of frequency and temperature on three samples of Tiva Canyon Tuff. Average grain size (determined by TEM) given above plots. As the dominant grain size increases, so does the temperature of the peak in both in-phase and out- of-phase susceptibility, which corresponds to the blocking temperature. The sample shown in panel b with average grain size of 37 x 7.5 nm is the same as in Figure 2 (circles) and Figure 3.
In between the fully unblocked state (Eq. (5)) and the fully blocked state (Eq. (6)), susceptibility will be at a maximum near (Figure 4), where . Susceptibility will now depend both on and on the frequency () of the AC field. Also in this interval (), the sample moment will tend to lag behind the alternating field, and the measured signal can be broken down into a component that is in-phase with the applied field () and a component that is out-of-phase ():
and . At low and short () the moment can “keep up” with the driving field, and the out-of-phase signal will be small. At higher and longer , the magnetization will lag farther behind, leading to a larger out-of-phase signal. In this way, we also see that both the in-phase and out-of-phase susceptibility components are frequency-dependent as the sample passes through the blocking temperature interval (Figure 4).
Figure 5:AC susceptibility measured as a function of frequency and temperature on same synthetic basaltic sample shown in Figure 2 (squares). Data show evidence for a broad SP grain-size distribution. Additionally, the rapid decrease in susceptibility from 10K to 50K results from a significant paramagnetic fraction.
As in the unblocking of a low-temperature SIRM, a discrete, narrow grain-size population will result in a relatively narrow temperature range over which frequency-dependence is observed and in a well-defined maximum in susceptibil- ity (e.g. Figure 4a). This peak shifts to higher temperatures for a larger dominant grain size (Figure 4b,c). A broad grain-size distribution will result in a broad peak and/or frequency-dependence over a large temperature interval (e.g. Figure 5).
Thermal fluctuation tomography
Another approach for jointly characterizing SP volume and microcoercivity () distributions is thermal fluctuation tomography (Jackson et al., 2006).
Superparamagnetic Imposters
The caution above noted other phenomena that might be mistaken for superparamagnetic behavior in the absence of additional information, and we briefly re-iterate this caution here. It is important to keep in mind that non-zero out-of-phase susceptibility can result from eddy currents or low-field hysteresis, in addition to thermally activated processes such as SP blocking or unblocking. One way to identify a thermally-activated process is to measure AC susceptibility at at least three frequencies; Néel theory predicts the relationship between and to be:
for non-interacting populations with smooth distributions of (see Shcherbakov and Fabian, 2005; Jackson, 2004). Note, however, that any thermally-activated process will obey this relationship; some electron-ordering phenomena in titanomagnetites, for example, appear to be thermally-activated (see, e.g. Carter-Stiglitz et al., 2006; Lagroix et al., 2004).
The gradual decrease in a low-temperature remanence on warming can be indicative of SP unblocking, but may also result from domain-wall reorganization (Moskowitz et al., 1998) or from partial oxidation. For the latter, the remanent magnetization decay <50 K, while still poorly understood, is probably related to additional anisotropy from surface-core coupling. The phase transition from spin glass to a ferri- or para-magnetic state often observed in titano-hematites is also accompanied by a dramatic decrease in low-temperature remanence on warming at temperatures <50–60 K. This transition is additionally characterized by frequency-dependent peaks in both and (Burton et al., 2008), but which do not obey Eq. (9).
Finally, samples with a large paramagnetic/ferromagnetic ratio may exhibit a similar decrease resulting not from any real change in remanence, but from variation in an induced paramagnetic signal in the presence of an imperfectly-zeroed field (see the paramagnetic low-temperature behavior section).
References
Berquó, T.S., Banerjee, S.K., Ford, R.G., Penn, R.L., & Pichler, T. (2007). High-crystallinity Si-ferrihydrite: An insight into its Néel temperature and size dependence of magnetic properties. J. Geophys. Res., 112, B02S02. Pasqualini et al. (2007)
Burton, B.P., Robinson, P., McEnroe, S.A., Fabian, K., & Boffa Ballaran, T. (2008). A low-temperature phase diagram for ilmenite-rich compositions in the system Fe₂O₃–FeTiO₃. American Mineralogist, 93, 1260–1272. Burton et al. (2008)
Carter-Stiglitz, B., Moskowitz, B., Solheid, P., Berquó, T.S., Jackson, M., & Kosterov, A. (2006). Low-temperature magnetic behavior of multidomain titanomagnetites: TM0, TM16, and TM35. J. Geophys. Res., 111, B12S05. Carter‐Stiglitz et al. (2006)
Dunlop, D.J. (1965). Grain distributions in rocks containing single-domain grains. J. Geomag. Geoelec., 17, 459–471. DUNLOP (1965)
Dunlop, D.J., & Özdemir, Ö. (1997). Rock Magnetism: Fundamentals and Frontiers. Cambridge University Press, New York.
Egli, R. (2009). Magnetic susceptibility measurements as a function of temperature and frequency I: inversion theory. Geophys. J. Int., 177, 395–420. Egli (2009)
Jackson, M. (2004). Imaginary Susceptibility: A Primer. IRM Quarterly, 13(4). https://
Jackson, M., Carter-Stiglitz, B., Egli, R., & Solheid, P. (2008). Characterizing the superparamagnetic grain distribution f(V,Hk) by thermal fluctuation tomography. J. Geophys. Res., 113, B12S07. van Stiphout et al. (2009)
Lagroix, F., Banerjee, S.K., & Jackson, M.J. (2004). Magnetic properties of the Old Crow tephra: Identification of a complex iron titanium oxide mineralogy. J. Geophys. Res., 109, B01104. Lagroix et al. (2004)
Moskowitz, B.M., Jackson, M., & Kissel, C. (1998). Low-temperature magnetic behavior of titanomagnetites. Earth Planet. Sci. Lett., 157, 141–149. Moskowitz et al. (1998)
Néel, L. (1949). Théorie du trainage magnétique des ferromagnétiques en grains fins avec application aux terres cuites. Ann. Géophys., 5, 99–136.
Schlinger, C.M., Veblen, P.R., & Rosenbaum, J.G. (1991). Magnetism and magnetic mineralogy of ash flow tuffs from Yucca Mountain, Nevada. J. Geophys. Res., 96, 6035–6052. Schlinger et al. (1991)
Shcherbakov, V., & Fabian, K. (2005). On the determination of magnetic grain-size distributions of superparamagnetic particle ensembles using the frequency dependence of susceptibility at different temperatures. Geophys. J. Int., 162, 736–748. doi:10
Worm, H.-U., & Jackson, M.J. (1999). The superparamagnetism of the Yucca Mountain Tuff. J. Geophys. Res., 104, 25,415–25,425. Worm & Jackson (1999)
Worm, H.-U. (1998). On the superparamagnetic-stable single domain transition for magnetite, and frequency dependence of susceptibility. Geophys. J. Int., 133, 201–210. doi:10
- Pasqualini, D., Heitmann, K., TenCate, J. A., Habib, S., Higdon, D., & Johnson, P. A. (2007). Nonequilibrium and nonlinear dynamics in Berea and Fontainebleau sandstones: Low‐strain regime. Journal of Geophysical Research: Solid Earth, 112(B1). 10.1029/2006jb004264
- Burton, B. P., Robinson, P., McEnroe, S. A., Fabian, K., & Ballaran, T. B. (2008). A low-temperature phase diagram for ilmenite-rich compositions in the system Fe2O3-FeTiO3. American Mineralogist, 93(8–9), 1260–1272. 10.2138/am.2008.2690
- Carter‐Stiglitz, B., Moskowitz, B., Solheid, P., Berquó, T. S., Jackson, M., & Kosterov, A. (2006). Low‐temperature magnetic behavior of multidomain titanomagnetites: TM0, TM16, and TM35. Journal of Geophysical Research: Solid Earth, 111(B12). 10.1029/2006jb004561
- DUNLOP, D. J. (1965). Grain Distributions in Rocks Containing Single Domain Grains. Journal of Geomagnetism and Geoelectricity, 17(3–4), 459–471. 10.5636/jgg.17.459
- Egli, R. (2009). Magnetic susceptibility measurements as a function of temeperature and freqeuncy I: inversion theory. Geophysical Journal International, 177(2), 395–420. 10.1111/j.1365-246x.2009.04081.x
- van Stiphout, T., Kissling, E., Wiemer, S., & Ruppert, N. (2009). Magmatic processes in the Alaska subduction zone by combined 3‐D b value imaging and targeted seismic tomography. Journal of Geophysical Research: Solid Earth, 114(B11). 10.1029/2008jb005958
- Lagroix, F., Banerjee, S. K., & Jackson, M. J. (2004). Magnetic properties of the Old Crow tephra: Identification of a complex iron titanium oxide mineralogy. Journal of Geophysical Research: Solid Earth, 109(B1). 10.1029/2003jb002678
- Moskowitz, B. M., Jackson, M., & Kissel, C. (1998). Low-temperature magnetic behavior of titanomagnetites. Earth and Planetary Science Letters, 157(3–4), 141–149. 10.1016/s0012-821x(98)00033-8
- Schlinger, C. M., Veblen, D. R., & Rosenbaum, J. G. (1991). Magnetism and magnetic mineralogy of ash flow tuffs from Yucca Mountain, Nevada. Journal of Geophysical Research: Solid Earth, 96(B4), 6035–6052. 10.1029/90jb02653
- Worm, H., & Jackson, M. (1999). The superparamagnetism of Yucca Mountain Tuff. Journal of Geophysical Research: Solid Earth, 104(B11), 25415–25425. 10.1029/1999jb900285